Padlock probes

In last month’s installment, we covered some of the ways in which a ligation step can be added into (or before) a PCR-based methodology to improve one or more aspects of the assay. While the topic of this month’s article—padlock probes—also fits this description, it’s unusual enough in its design and assay features to deserve its own column.

PCR reactions are, by and large, rather individualistic and temperamental things. Optimization of any reaction is a balance between sensitivity and specificity, chosen by tailoring reaction chemistry (components and concentrations) and conditions (times and temperatures of the thermocycling profile). In the context of a simplex (single-target) reaction, all of these can be optimized at will, but if the goal is a multiplex reaction, things get a lot more complicated.

Selecting all primer sets to have similar melting temperatures is probably the most crucial step, and to do so while ensuring uniqueness and thus specificity of primer binding sites generally leads to a range of amplicon sizes and differential amplification efficiencies of the separate amplicons in the mixture. While this can be compensated for to some extent by things such as differential primer concentrations, in the end a multiplex traditional PCR must be a sum of many compromises to reach acceptable (but almost certainly suboptimal) performance of each of the component singleplex reactions. It’s just a natural consequence of the need for different primer sets, amplicon sizes, and dissimilar probe or hybridization capture regions within each singleplex.

Imagine now if there were a method that could multiplex large numbers of singleplex targets, but do it in such a way that a single common primer set could amplify every target (no more compromising on annealing temperatures); all targets could be the same length (no more compromising on extension times); and a real-time probe or hybridization capture tag sequence could be engineered in, assuring both that each possible amplicon would be readily distinguishable and that the probe or hybridization capture tags would all have very similar annealing behavior. It’s as if you’re promised a magical beast which does away with many of the classical challenges of multiplexing. Such an assay method does exist in the form of padlock probes. As always, though, there are costs; read on to discover the method, and what those costs are.

Padlock probe basics

The basic concept of a padlock probe is outlined in Figure 1. Essentially, it consists of a single-stranded synthetic DNA probe designed against each target of interest (a). The 5′ and 3′ termini of this probe are target-specific; they’re designed to be complementary to two immediately adjacent sequences of the target nucleic acid, labeled here as R1 and R2. If the padlock probe is mixed with target nucleic acids containing these sequence complements, thermally denatured and reannealed, it can hybridize down to its target at both ends, effectively circularizing the probe and placing its 3′ and 5′ ends immediately next to each other, but with a nick—that is, missing the phosphodiester bond; see Figure 1b. If a DNA ligase is present—preferably, one from a thermostable organism so it could have been added during reaction setup, prior to thermal denaturation—it can now act at this nick, converting a previously linear padlock probe into a covalently closed circular molecule; see Figure 1c. In some versions of this type of assay, we will actually run a few cycles of denaturation / annealing / wait for possible ligation in an effort to drive formation of multiple copies of this circular product.

Of course, this doesn’t occur to every padlock probe we added into the reaction, but only to a small fraction. That’s fine, and to get rid of uncircularized probes we now add in single strand-specific DNA exonucleases. These “chew up” linear single-stranded DNA but leave any circular molecules intact. Now all we have to do is detect these.

Figure 1. a) Padlock probe as synthesized. b) Padlock probe successfully annealed to target sequences at R1 and R2, awaiting ligation. c) Ligated, circularized padlock probe. (*) represents ligated nick, which now allows PCR primer sequences PB1′ and PB2 to amplify across the ligated junction. See text for additional details.

That’s where we switch back to classical PCR—eithker in a real-time format or upstream of a hybridization capture-based detection (that is, a microarray). If you look back at Figure 1, you’ll note that on the padlock probe, internal to the target-specific R1 and R2 ends, are a pair of primer binding sites PB1 and PB2. The key here is that these work with a pair of primers; let’s call them PB1′ (complement to PB1) and PB2 (identical in sequence to PB2; see Figure 1c). If we conduct a standard PCR reaction with these primers and have any circularized padlock probe present, consider what happens. PB1’ binds to the circularized probe and gets extended across the now-ligated R1/R2 junction, and out across PB2, creating a complement to PB2, and thus a binding site for the PB2 primer. Consider that if the padlock probe hadn’t circularized, the nascent strand growing from PB1′ would have run out of template and stopped at the R1/R2 junction, thus never reaching PB2. Only a circularized template allows for PB1’ to extend across the PB2 site, creating what is now a “normal” linear PCR template for the PB1′ / PB2 primer pair. PCR amplification proceeds normally from there on.

Further observations

There are two things to observe at this juncture. First, note that any number of padlock probes could be used simultaneously with differing R1/R2 (target-specific) regions, but sharing a single PB1′/PB2 amplifying primer pair. That’s where our promise above of using a single common primer set to amplify disparate targets comes from—so we only have to optimize PCR for this single PB1′/PB2 primer set (and note as well that we can design these sequences at will to have convenient thermal characteristics, lack of secondary structures, and other desirable characteristics; they aren’t constrained to be part of any assay target sequence).

A second possible observation: what if instead of classical PCR, we used just the PB1′ primer, a polymerase, and did an isothermal amplification? If you’re guessing this would leave the polymerase racing around and around the closed padlock probe template and creating an ever-lengthening nascent strand consisting of concatemer linear copies of the circular sequence, you’re right. Known as rolling circle replication or RCR, that’s something we could do here as well. It would not be quite as specific as direct PCR (needing both primers PB1′ and PB2 to match) and wouldn’t yield as much signal amplification as classical PCR, but it would effectively tether the growing product to the point of amplification. RCR-based padlock probe detection is therefore sometimes used for in situ molecular detection, where we want to know localization of targets to specific cell types such as in a tissue thin section. For the sake of brevity though, we’ll stick to just the classical PCR-based detection of our padlock probe for the remainder of this article.

So that then brings us to the PCR detection part. If we assume we have probed a sample with several different padlock probes (remember, each type with unique R1/R2 regions but shared PB1/PB2), and all of identical or close to identical total length), how do we tell them apart after our PCR has amplified up any probes which circularized? The answer here is given in Figure 1 as well. Note that we’ve incorporated a unique tag sequence in each padlock probe. Much like the PB1/PB2 sequences, these are arbitrary and up to the whims of the designer, meaning they can be chosen to provide highly selective hybridization capture tags (that is, complements to a series of spots in a premade microarray) or binding sites for real-time PCR probes suitable for our choice of probe-based real-time chemistry. Again, we can pre-design a whole set of such probe sequences optimized for similar hybridization behavior with minimal cross-hybridization, bothersome secondary structures, or other problems. The answer to our method of detection then can be either of real-time PCR (probe based against the tag) or microarray hybridization (against the tag). Obviously, if we’re going to multiplex more than four to six targets simultaneously—the practical limit imposed by spectral resolution issues in real-time PCR—then array-based detection is preferable. Keep in mind, however, that we needn’t make a new array each time we want to change a target of our multiplex assay; we only need to change the target-specific R1 and R2 regions of the padlock probe which carries a predetermined array tag. Of course the same argument applies if we did use real-time detection, too.

This final point—that we could premake a microarray, or set of real-time probes, and mix and match these against targets at will without redesign of the amplification primers or detection probes or array—is the icing on the cake, as it were, to our laundry list of desirable features which padlock probes have as a methodology over more traditional multiplex PCRs.

Considering the costs

The costs, then? These occur in the form of higher reaction complexity in terms of what has to go together and work in the reaction tube, not just PCR reagents but also a ligase and exonucleases. Since we don’t want the ligase or the exonucleases working later on in the reaction, these have to be effectively inactivated, usually by an extended, high temperature step, after their point of action. The hybridization kinetics of a long padlock probe to target is not generally as fast or good as short, classical PCR primers, so lower limits of detection by this method may lag behind those of more direct PCR. Finally, synthesis of padlock probes, on the order of 100 bp in size, is more expensive and lower yield than synthesis of shorter, traditional PCR primer-sized molecules (However, compared to a few years ago, costs have decreased and yields increased significantly for longer oligonucleotides such as this, making that less of a hurdle than it used to be.)

Where is the laboratorian today likely to come across this type of assay? The most common application at present is probably in the detection of single nucleotide polymorphisms (SNPs). By placing the SNP of interest directly under either side of the R1-R2 junction, a mismatch to padlock probe will block ligation, or, conversely, a match will allow ligation and selective signal generation only when a perfect match occurs. Small insertions or deletions under the R1/R2 target area will also block effective circularization. Beyond such genotyping applications, other uses in the literature have included multiplex pathogen detection assays.

Source: https://www.mlo-online.com/home/article/13009460/padlock-probes

ELISA Sample Preparation & Collection Guide

The ELISA sample collection and storage conditions listed below are intended as general guidelines. Specific protocols may vary by cell line or tissue type. If storing sample for extended length of time, testing sample stability is recommended. Avoid repeated freeze-thaw cycles for all sample types.

Serum – Use a serum separator tube (SST) and allow samples to clot for 30 minutes at room temperature before centrifugation for 15 minutes at 1000 x g. Remove serum and assay immediately or aliquot and store samples at ≤ -20 °C.

Plasma – Collect plasma using EDTA, heparin, or citrate as an anticoagulant. Centrifuge for 15 minutes at 1000 x g within 30 minutes of collection. Assay immediately or aliquot and store samples at ≤ -20 °C.

Platelet-poor Plasma – Collect plasma using EDTA, heparin, or citrate as an anticoagulant. Centrifuge for 15 minutes at 1000 x g within 30 minutes of collection. An additional centrifugation step of the plasma at 10,000 x g for 10 minutes at 2-8 °C is recommended for complete platelet removal. Assay immediately or aliquot and store samples at ≤ -20 °C.

Cell Culture Supernates – Remove particulates by centrifugation at 500 x g for 5 minutes. Remove supernate and assay immediately or aliquot and store samples at ≤ -20 °C.

Tissue Homogenates – The preparation of tissue homogenates will vary depending upon tissue type. Rinse tissue with 1X PBS to remove excess blood, homogenized in 20 mL of 1X PBS and stored overnight at ≤ -20 °C. After two freeze-thaw cycles were performed to break the cell membranes, the homogenates were centrifuged for 5 minutes at 5000 x g. The supernate was removed immediately and assayed. Alternatively, aliquot and store samples at ≤ -20 °C.

Cell Lysates – Solubilize cell in lysis buffer and allow to sit on ice for 30 minutes. Centrifuge tubes at 14,000 x g for 5 minutes to remove insoluble material. Aliquot the supernatant into a new tube and discard the remaining whole cell extract. Quantify total protein concentration using a total protein assay. Assay immediately or aliquot and store at ≤ -20 °C.

Tissue Lysates – Rinse tissue with PBS, cut into 1-2 mm pieces, and homogenize with a tissue homogenizer in PBS. Add an equal volume of RIPA buffer containing protease inhibitors and lyse tissues at room temperature for 30 minutes with gentle agitation. Centrifuge to remove debris. Quantify total protein concentration using a total protein assay. Assay immediately or aliquot and store at ≤ -20 °C.

Saliva – Collect saliva in a tube and centrifuge for 5 minutes at 10,000 x g. Collect the aqueous layer, assay immediately or aliquot and store samples at ≤ -20 °C.

Urine – Aseptically collect the first urine of the day (mid-stream), voided directly into a sterile container. Centrifuge to remove particulate matter. Assay immediately or aliquot and store at ≤ -20 °C.

Human Milk – Centrifuge for 15 minutes at 1000 x g at 2-8 °C. Collect the aqueous fraction and repeat this process a total of 3 times. Assay immediately or aliquot and store at ≤ -20 °C. R&D Systems offers an extensive ELISA portfolio for your research.

Source: https://www.rndsystems.com/resources/protocols/elisa-sample-preparation-collection-guide#:~:text=Plasma%20%2D%20Collect%20plasma%20using%20EDTA,at%20%E2%89%A4%20%2D20%20%C2%B0C.

内吞体的分离方法

As a functional unit of a living entity, cells are very complicated and consist of exceptionally high number of biomolecules with completely different physical and chemical properties. The complexity of the biomolecules profile is even more intricately woven depending upon their subcellular location. With the limited resolution of the separation and localization technologies, it is imperative to employ fractionation methods for protein profiling and expression analysis.  Even the lesser abundant proteins can be analysed if screened after prefractionation. Sensitive and accurately fractionated samples help in convolution of methods such as mass spectrometry or in-vitro analysis for the detection of proteins at the level of organelles or transportation compartments.

Endosomal organelles are enriched with many proteins that are being transported across the cell for performing vital functions in a compartment-specific manner. Endosomes are membrane-bound vesicular organelles that are crucial for transportation, sorting and synthesis of many macromolecules. Isolation of endosomes provides a lot of information about compartment-specific profiling of the macromolecules.

Compilation of previous studies reflects the spatio-temporal existence of different stages of endosomes such as early endosomes and late endosomes. All these subpopulations vary dramatically in terms of proteomic composition and complexity. Isolation of these endocytic organelles provides a fundamental tool of understanding intracellular signalling events. Over the last few years, various methods were developed to enhance the knowledge about endocytic proteins and their isolation. This blog will discuss briefly about the methods of isolation of endosomes and their further analysis.

Density gradient-based ultracentrifugation

Subcellular fractionation using density gradient based centrifugation provides a great method to isolate endosome organelles and multi-protein complexes.

The overall method has two crucial steps:

  1. Homogenization: The tissue/cells are homogenized in suitable media to burst open the cell membrane and release the cell organelles and cytoplasmic components into the lysis buffer. The collected cells are briefly centrifuged to remove the cellular debris, unbroken cells, and nuclei. The supernatant obtained at this step consist of cell organelles or membrane bound proteins.
  2. Ultracentrifugation based fractionation: The post-nuclear supernatant obtained after homogenization can be separated into its components using different gradients followed by ultracentrifugation. Discontinuous gradients and step gradient, both of these methods are applicable for the fractionation. The place where a particular membrane or endocytic organelle can be isolated in the gradients is based on the ratio of the lipid content of the endosomes to their protein contents. Heavier cell organelles such as mitochondria and endoplasmic reticulum have high protein content; therefore tend to settle at the bottom of the gradient. Lipid-rich organelles such as endosomes have low density therefore they are isolated from the middle layers or upper layers of the gradient.
    In order to enhance the resolution of the fractionation, the most preferred method for this is using equilibrium separation in a continuous gradient. The post-nuclear supernatant is allowed to equilibrate in a continuous gradient in order to distribute the endosomes of different densities according to their sedimentation quotient. Since the abundance of same density endosome is already low, the only disadvantage of using equilibrium separation is getting a diluted fraction of the endosomes. This drawback can be negated by applying prefractionation approaches such as chromatographic separation, which helps in enriching the sample further.

Endosome_Fractionation_Gradients
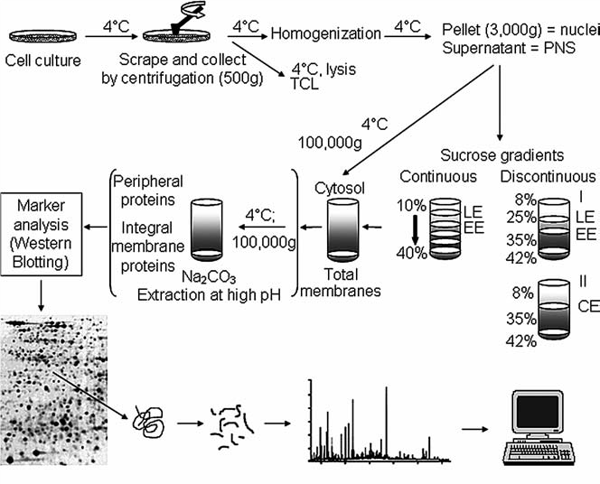
Figure 1: Schematic outline of fractionation and isolation of endosomal organelles using gradient based ultracentrifugation followed by proteome analysis. Source: Araújo et al., Methods in Molecular Biology. 2008.

Fluorescence-activated organelle sorting (FAOS)

This method utilizes basic principles of flow cytometry to sort and detect the specific endosomes having peculiar light scattering and fluorescent properties. Fluorescent probes, labelled antibodies or fluorescent proteins are used to tag specific organelles. In a way, fractionation is coupled with high speed sorting of the endosomes. The limiting factor in this technique is to decrease the background signal created by the absorption of light by the contents of the sample.

Endosomes_Flow_Cytometry

Figure 2: Diagrammatic representation of FAOS. Source: Stasyk and Huber, Proteomics, 2005. 

Free Low electrophoresis (FFE) and Flow Field-Flow Fractionation

This method harnesses the property of differential mobilities of different organelles based on their membrane properties when exposed to an electric field followed by collection of the sample at different time points. Principally, the sample is allowed to move in a laminar flow manner and then a suitable electric field is applied perpendicular to the flow. The resultant potential causes the displacement of organelles along the electric field. The final displacement and mobility of the organelles is decided by the surface biomolecules and the net charge on them. This is a great tool to isolate an enriched fraction of the organelles especially the small ones such as endosomes. Each fraction can be used for further analysis based on the organelle specific biomarkers.

Free_Flow_Electrophoresis

Figure 3: Schematic representation of a free flow electrophoresis. Source: Ho S et al, Journal of Materials Chemistry, 2009.

Immunoisolation of endosomes

This method relies on binding separation of organelles using their antigenic properties rather than using their physical properties, unlike other isolation methods. The basic principle is closely similar to antibodies and antigen binding as any other immunological method. However, the parameters of choosing antigens, antibodies and the support on which it is growing vary substantially.

  1. Antigens: Immunoisolation works on a one to one ratio which suggests a single epitope is enough for separating a single vesicle. Therefore, the epitope that should be chosen must be exclusively present on the desired endosomal compartment. Since, this method does not consider the variation in physical properties such as density of the antigen; therefore, this method is not suitable for differential immunoisolation. Care should be taken about the accessibility of the selected epitope. It should be easily accessible to the antibody which is immobilized on a solid surface. It is always suggested to select the epitope which has higher abundance to increase the efficiency of binding.
  2. Antibodies: Antibodies are held on a solid support in this method, therefore two different types of antibodies are used for an efficient binding.
    1. Linker antibody- it is used to enhance the range of binding and flexibility of the specific antibody.  It couples the solid surface beads with the specific antibody to allow endosomal binding. Mostly commonly a generic anti-Fc antibody is used as a linker antibody.
    2. Specific antibody: These antibodies are raised against the epitope present on the surface of the endosomes that are required to be isolated. It is suggested to use an affinity purified polyclonal antibody. However, the binding of antibody with the endosomes require optimisation and calibration.
  3. Solid Support/matrix:Binding of the linker antibody on a solid surface is crucial. It is also imperative to choose a solid matrix carefully.
  • Flexibility: An ideal matrix should be flexible enough to bind with the antibody without a positional disorientation and conformational hindrance.
  • Sedimentation: Matrix should be able to aggregate and sediment easily at a very low speed like 3000 x g at which the endosomes do not co-sediment. It should not be cross linking with the endosomes as well so that both of these can be easily separated after binding.

The most common modification of immunoisolation is the use of Magnetic beads. This approach is beneficial in being rapid, gentle and efficient. It does not require high speed centrifugation or density gradient based fractionation for separation of endosomes. It is also a useful method to isolate differential densities of endosomes with greater efficiency and purity.

Immunoisolation

Figure 4: Schematic representation of magnetic beads based immunoisolation. Source: Lordachescu A et al., Royal Society of Chemistry Advances, 2018

 Magnetic beads can be used in two ways:

  • Direct Binding: The magnetic beads are incubated with the antibody first for a short duration followed by a longer incubation with the crude sample containing endosomes. The targeted endosomes attached with the beads can then be separated by using a magnet and few washing steps.
  • Indirect Binding: In this protocol, the antigen and the antibodies are allowed to bind first. Magnetic beads are added with the antigen/ligand mix later on and allowed to bind for some time. The extraction and purification method is similar as that of direct binding technique.

Direct binding technique is recommended when the antigen is easy to access. When the targeted antigen is difficult to access, the indirect binding technique is preferred.

Points to be considered during endosomal isolation:

  1. Nuclear rupture while homogenisation releases DNA resulting into increased viscosity of the solution. Therefore, enough detergent has to be added to maintain the consistency of the homogenate.
  2. Cross contamination of the samples should be avoided from the standards.
  3. Endosomes are very fragile under ionic conditions. Therefore, the homogenisation of the tissue should be very mechanical and mild in order to avoid their rupture.
  4. While making gradient in the density-gradient fractionation, air bubbles should be avoided as they interfere with the continuity of the gradient.
  5.  The layers after ultracentrifugation should be collected carefully so as to obtain a pure population of the organelles.
  6.  Endosomal population obtained after the method should be checked for purity using endosomal markers.

来源: https://info.gbiosciences.com/blog/four-methods-for-endosomal-isolation

Choosing the right tool for designing guide RNAs

https://www.takarabio.com/learning-centers/gene-function/gene-editing/gene-editing-tools-and-information/sgrna-design-tools

The first step of CRISPR/Cas9 gene editing is designing a single guide RNA (sgRNA) to target your gene of interest. Because sgRNAs are solely responsible for recruiting Cas9 to specific genomic loci, optimal sgRNA design is critical for successful gene editing experiments. There are many web-based tools available for sgRNA design, each of which has different features and advantages. The information provided here will help you choose the best tool for your specific research objective.

Several web-based tools available

Web-based sgRNA design tools typically require that users input a DNA sequence, genomic location, or gene name for each gene of interest, and indicate a species. An algorithm specific to each tool outputs a list of candidate guide sequences with corresponding predicted off-target sites for each input (Wu et al. 2014). Most tools aim to provide guide sequences that minimize the likelihood of off-target effects, but the methods they employ vary. For example, Chop Chop uses empirical data from multiple recent publications (e.g. Doench et al. 2016) to calculate efficiency scores. Alternatively, CasFinder (Aach et al. 2014) and E-CRISP (Heigwer et al. 2014) incorporate specific user-defined penalties based on the number and position of mismatches relative to the guide sequence in order to rank the potential for off-target effects.

Tools for specific applications

Some sgRNA design tools have been developed for specific applications. CRISPR-ERA (Liu et al. 2015) is the only currently available tool that designs sgRNAs specifically for gene repression or activation, while FlyCRISPR (Gratzet al. 2013) focuses on applications in fly, beetle, and worm species, including the popular model organisms Drosophila melanogaster and Caenorhabditis elegans. Presently, the design tool featured on the Benchling website is the only one that can generate candidate sgRNAs that are compatible with alternative nucleases such as Staphylococcus aureus Cas9 (Ran et al. 2015) and Cpf1 (Zetsche et al. 2015). Given the uniqueness of each tool, we recommend that you use multiple approaches during the sgRNA design process and choose guide sequences that are consistently predicted to perform well.

A selection of freely available tools

The table below provides a list of web-based tools for sgRNA design. For simplicity, we have only included those that are free and do not require a subscription. For each tool, we have indicated whether there is a convenient graphical user interface or if the user has to download a script. If you would prefer to design sgRNAs manually, please visit Choosing a target sequence for CRISPR/Cas9 gene editing to learn more.

Neutralizing antibodies for AAV vectors: The strange case of AAV5

The recent approval by the U.S. Food and Drug Administration of gene therapies for eye and muscle disorders and the growing number of clinical trials with adeno-associated virus (AAV)–derived vectors clearly indicates the maturity of this method of gene replacement for the use in humans. The large clinical experience in liver gene transfer with AAV mostly derives from clinical trials for the treatment of two coagulation disorders, hemophilia A and B. Data from different trials strongly support the safety and the efficacy of the approach.

One major limitation of the systemic administration of AAV is the presence of preexisting neutralizing antibodies against the vector. Indeed, seropositivity for AAV is among the exclusion criteria in most of the AAV gene therapy trials. Early studies indicated that very low titers of neutralizing antibodies in circulation prevented vector entry and resulted in reduced liver transduction. So far, patients injected with AAV vectors had little to none anti-AAV neutralizing titers. This was true until the results of the clinical trial sponsored by uniQure for the treatment of hemophilia B with an AAV5 vector expressing human coagulation factor IX (hFIX) were public.

The assay used to measure preexisting neutralizing antibodies in the patients of the trial was based on green fluorescent protein (GFP) as a reporter and had a limited sensitivity. By using a more sensitive assay, based on luciferase as reporter, Majowicz et al. demonstrated that three of the patients included in the clinical trial were seropositive for AAV5 with titers that have been associated with in vivo neutralization of liver transduction in preclinical animal models. Importantly, in the patient who had the highest neutralizing titers, the expression of hFIX was similar, if not superior, to that of patients of the same dose cohort. This suggests that the serotype used in the trial, for some reason, was less sensitive to antibody neutralization. To support the clinical data, they performed an in vivo neutralization assay in nonhuman primates (NHPs). In this experiment, they tested four increasing doses of vector in a range that cover the doses of AAV normally administered in the clinic. The NHPs dosed were all seropositives for anti-AAV5 neutralizing antibodies with titers spanning from low (1/57) to relatively high (1/1030). Interestingly, they did not see the expected inverse correlation between the neutralizing titers and the transduction efficacy as measured by hFIX protein secreted in circulation.

One important caveat in the interpretation of the results of this study is the absence of standardized methods to measure vector and neutralizing antibody titers. This represents a major limitation in the field of gene therapy that hampers the comparison of data between the different laboratories and the exact reproduction of the data. Despite this, in 2018, Biomarin announced the dosing of the first hemophilia A patient having anti-AAV5 neutralizing titers. An eventual confirmation of the data obtained from Majowicz and colleagues in this second clinical trial would strongly suggest that AAV5 has a certain “resistance” to neutralization. This resistance, in principle, may allow for the inclusion of seropositive individuals, thus expanding the number of patients treatable by AAV gene therapy.

Refer: https://www.sciencedirect.com/science/article/pii/S2329050119300531#sec4

GFP-Based Anti-AAV5 NABs Assay

The assay entails incubation of the 1:50 dilution of test sera with an AAV5-based reporter vector that carries the GFP gene. This incubation allows any neutralizing antibodies, or other interfering factors present in the test serum, to bind to the reporter vector particles. These mixtures were subsequently transferred to wells seeded with HEK293 cells in a 96-well plate format, allowing non-neutralized reporter vector particles to transduce cells and express GFP. The cells were analyzed by flow cytometry for the percentage of GFP-expressing (and hence fluorescent) cells. Each analytical run included negative controls (control sample without AAV5-GFP reporter vector addition and pooled human serum control negative for anti-AAV5 NABs as determined during the assay development). Additional technical controls include a negative and positive assay control, consisting of monkey serum obtained pre- and post-immunization with AAV5-hFIX, respectively. The readout of the assay was the percent of inhibition of transduction, relative to normalized negative control serum. This percentage inhibition of transduction is then held against the pre-defined cut-point of 29%, which means that test sera that inhibit transduction by 29% or more are considered positive. Cut-point (cut-point = mean % inhibition + 2.33 × SD) was calculated at the 99% confidence level from the percent inhibition data obtained from the initial four test runs of 48 human sera samples screened in the development of GFP-based anti-AAV5 NABs assay.

Luciferase-Based Anti-AAV5 NABs Assay

The assay entails incubation of the test sera dilution series with an AAV5-based reporter vector that carries the luciferase gene. As in the GFP-based assay, this incubation allows neutralizing antibodies in the test serum to bind to the reporter vector particles. These mixtures are subsequently transferred to wells seeded with HEK293T cells in a 96-well plate format, where reporter vector particles can transduce cells and mediate expression of luciferase. After 2 h, the supernatants of each well are replaced by cell culture medium to maintain maximum cell viability. On the next day, all wells are analyzed for luciferase expression by luciferin substrate conversion-based chemiluminescent readout. The anti-AAV5 neutralizing antibody titer is determined with the use of LabKey software analysis that calculates the percent of neutralization for each serum dilution after subtraction of background activity and fits a curve to the neutralization profile. This curve is used to calculate neutralizing antibody titers, area under the curve (AUC), and error estimates. The four-parameter method is currently used to calculate curve fits. LabKey calculates IC50, the dilution at which the antibodies inhibit transduction by 50%. LabKey also calculates “point-based” titers. This is done by linearly interpolating between the two replicates on either side of the target neutralization percentage. Each analytical run includes positive controls (wells without sample sera but with AAV5-luciferase), negative controls (wells that have only medium, without sample sera and without AAV5-luciferase), and negative control sample serum (heat-inactivated fetal bovine serum [FBS]) to assess the specificity of AAV5-luciferase neutralization. MOI in the luciferase-based anti-AAV5 NABs assay was 378.4, whereas the target relative light units (RLUs) that were to be read in the luminometer after AAV5-luciferase transduction of HEK293T cells in the positive control wells were to be approximately 1000 RLUs, and negative control wells that consisted of only HEK293T cells would have reads of approximately 50 RLUs.

病毒载体的基本元件及其优化

一. 启动子

启动子是可以启动目的基因转录的DNA序列,该序列可以被RNA聚合酶所识别,并开始转录合成RNA。启动子可以和调控基因转录的转录因子产生相互作用,控制基因转录的起始时间和转录的强度,它就像 “开关”一样,决定基因的活跃程度,继而控制细胞开始生产哪一种蛋白质。目前绝大多数的基因治疗产品,都的是病毒启动子。这主要是还是从提高蛋白表达效率的角度出发,希望尽可能地利用少量的病毒去表达尽可能多的目标蛋白。而病毒的启动子往往是强的组成型启动子,他们可以在宿主细胞内,招募宿主的转录因子,达到比宿主启动子高得多的转录水平。并且在长期的进化中,病毒的基因组结构已经变得十分紧凑,长度较短,非常适合应用于基因治疗载体。

目前最常见的病毒启动子是人巨细胞病毒的早期启动子(CMV-IE promoter/ CMV promoter),在CMV中,这个启动子负责IE1 和 IE2 基因前体 RNA 的转录起始。最常用的是一个600-800bp的CMV enhancer/promoter/UTR的融合版本,它能够在许多的组织中达到一个高强度的转录水平。但也有报道称,CMV 启动子驱动的蛋白表达水平会随着培养时间的延长而降低,宿主细胞会提高DNA甲基化的水平,从而将CMV启动子的转录沉默掉。

还有一些人工组合的启动子(有些也融合了也包含了部分intron序列在里面)也利用了CMV的部分序列,例如CAG(C,the Cytomegalovirus early enhancer element;A,chicken beta-Actin promoter; G, splice acceptor of the rabbit beta-Globin gene)、CBh启动子等等。CAG启动子的全长大约有1.8kb,’’结构较为复杂,具有非常强的转录活性和广泛的宿主范围。但由于序列过长,因此在应用于AAV时,具有明显的局限性。于是一些实验室在这个基础上开发了类似的混合启动子,在缩小了启动子尺寸的同时,大体保证了它的转录活性。例如简化的CAG/CBA启动子,简化后的序列长度仅有584bp。除了这些常见的病毒启动子之外,还有很多管家基因的启动子,也被用于基因治疗当中。比较普遍的包括1.2kb 的EF1-α 启动子、500bp 的PGK 启动子以及UBC启动子等等,但是其转录能力,就要弱于CMV、CAG等高强度的启动子们。

当大家只想在某些特定的器官或者特定类型的细胞内表达目的基因时,就需要使用组织特异性的启动子,或者给特定启动子加上一些组织特异性的调控原件。这样即使在载体没有特别好的靶向性的情况下,也可以限制目的基因在非靶标组织的表达泄露。例如胶质纤维酸性蛋白 (GFAP, 2.2 kbs) 启动子以及截短版本的gfaABC(1)D都被用来在星形胶质细胞中进行特异性的基因表达。此外还有在肌肉中常用的MCK,心肌中常用的cTNT,肝脏中常用的hAAT、ApoE等。但这些启动子也有很难克服的局限性:表达量低和尺寸较大。这是组织特异性表达需要给顺式作用元件提供大量的序列空间,因此其尺寸就必然要大于组成型启动子;另外组织特异性启动子需要被特定组织细胞内有限的反式作用因子所调控,即其所能被上调的峰值也是较低的。目前也有很多实验室通过生物信息学的方法来分析启动子及其调控原件的序列,精简或者串联多个不同来源的调控原件,以增强组特特异性表达的强度,也获得了一些喜人的突破。

在真核细胞中,有三种不同的 RNA 聚合酶,即 RNA 聚合酶 I、II 和 III。RNA 聚合酶 I 合成了大多数的 rRNA, RNA 聚合酶 II 转录所有 mRNA 和许多非编码 RNA,RNA 聚合酶III 则转录了其他的小的非编码(5S rRNA, snRNAs, snoRNAs, SINEs, 7SL RNA, Y RNA, 以及 U6 spilceosomal RNA等等)。如上所述,用于目的基因表达的启动子都是结合RNA 聚合酶 II,但如果基于想在病患体内表达功能性RNA例如shRNA、miRNA、sgRNA等等,这个时候就需要用到结合RNA 聚合酶 III的 III型启动子,目前最常用的有小鼠的U6启动子和H1启动子。而在让目的mRNA转录终止时,通常使用 T-stretch 作为终止信号,但终止效率和实际终止位点也并不是一致的。其中T4 信号是最小的终止信号,但完整的转录终结只有在 T-stretch ≥6 时才能达到。如果没有达到完整的转录终结,可能会产生低水平的 3′ 延伸 RNA,进而会干扰下游基因的表达。因此,在设计小 RNA 表达盒中至少应使用可以实现完全 Pol III 终止的T6/7 信号。

二. 转录后调控原件

在表达外源基因时,将一些转录后调控原件插入到3′ 非翻译区,可以增加mRNA在细胞内的积累水平并提高翻译效率,这样也可以在一定程度上增加外源基因的表达量。目前比较常用的是乙型肝炎病毒的转录后调控元件 (HPRE) 和土拨鼠肝炎病毒的转录后调控元件 (WPRE)。它们都是嗜肝DNA病毒的顺式作用 RNA 元件,可以通过促进 mRNA 从细胞核输出到细胞质来增加mRNA在细胞质 内的积累,增强3’端加工效率和mRNA稳定性。通常,未经剪接的 mRNA 会以较低的效率运输到细胞质中,然而一些细胞因子可能与 PRE 元件相互作用并介导其转录后的转运(RNA在核仁中转录后,会经过快速的加工过程,去除翻译的间隔区,产生成熟的mRNA,这些mRNA可以与核糖体结合并在细胞质中大量积累 。虽然前体RNA 的半衰期非常短~mins,但成熟的mRNA在细胞质中的半衰期则会较长~days。因此,帮助mRNA从核仁到细胞质的运输,在一定程度上提高了细胞内mRNA的积累水平)。然而,尽管 HPRE 、WPRE 对基因表达有益,但它们的序列相当长(600 bp),因此只能用于其他表达元件尺寸很小的表达框中。

三. polyA加尾信号

终止子位于基因序列的3’末端,通常直接出现在3′ 调节元件之后,它可以将新合成的mRNA 从转录复合物中释放出来。虽然启动子强度是决定基因表达水平的主要因素,但终止子在 RNA 加工中也发挥着重要作用,它会直接改变RNA 的半衰期,并最终导致基因表达水平的改变。目前常用的终止子包括SV40、hGH、BGH 和rbGlob,他们在序列上都包括促进多聚腺苷酸化和终止的motif AAUAAA。mRNA的转录终止和多聚腺苷酸化是一个协同过程,mRNA会在polyA加尾信号AAUAAA与下游的GU-Rich区之间发生切割,从而产生一个游离的 3′ 末端并用于在此基础之上进行polyA加尾。

四. 多顺反子载体—-一根藤上七个瓜

人类大多数的疾病并不是简单的单基因病,在治疗时,科研人员往往需要同时给与患者多种蛋白分子进行共同作用,因此基因治疗还要面对需要同时递送和表达几个目的蛋白的挑战。将多个基因克隆到一个载体中,从而进行多个基因的联合表达会在一定程度上提高基因治疗的有效性。目前常用的策略是在表达框中加入内部核糖体结合位点IRES或者加入有自切割功能的2A Peptides。

大多数情况下,真核生物的翻译起始需要mRNA的5’帽子与核糖体的小 (40S) 亚基以及许多翻译起始因子 (eIF) 相结合。而IRES 序列可以控制不依赖于5’帽子的蛋白质合成。IRES 序列大多是在病毒中发现的 ,大小多长于500 bp,目前最常用的是EMCV 和MSCV的IRES。

2A 肽是源自病毒的短肽 (~18-25 aa)。它们具有自我切割的功能,可以从同一个转录本中表达出多种蛋白质。但实际上,2A 肽的自我切割,并不是完整的把2A多肽切割下来,甚至它就不是真正的对翻译好的肽链进行切割。以源自口蹄疫病毒的2A 肽F2A为例-(GSG) VKQTLNFDLLKLAGDVESNPG P,F2A的功能是使核糖体跳过2A 肽 C 末端甘氨酸G和脯氨酸P之间肽键的合成,从而导致 2A 肽末端和下游肽段分离成两条多肽。因此,上游蛋白的 C 末端会添加额外的 2A 残基即(GSG) VKQTLNFDLLKLAGDVESNPG,而下游蛋白的 N 末端会添加额外的一个脯氨酸P。目前常用的2A肽有四种,P2A、T2A、E2A 和 F2A,它们来自于四种不同的病毒。

IRES 的主要缺点是两段蛋白的表达水平不一致,与多顺反子中的上游 ORF 相比,IRES 下游ORF 的表达水平会低很多(通常为上游表达水平的 10-20%)。IRES 元件也可能由于其尺寸(>500 bp)的问题,增加病毒包装的难度。2A 肽的缺点则是两个ORF 上留下的2A肽残基可能会影响目的蛋白的活性。此外,2A 肽的自切割不是 100% 有效的,并且切割效率会受到上下游 ORF 序列的强烈影响。因此,来自多顺反子的大部分翻译产物可能是未能自切割的融合蛋白,这在很多的应用中会是一个重要问题。在四种常用的 2A 肽中,P2A 通常具有最高的切割效率。接下来是 T2A,然后是 E2A 和 F2A。F2A的裂解效率仅为50%左右。

五. 表达框内的其他元素—-内含子与UTRs等

内含子的存在,可以影响包括转录、多聚腺苷酸化、mRNA 输出、翻译效率和 mRNA 降解在内的基因表达的各个步骤。然而前体RNA的剪接其实是一个非常耗能的步骤,剪接体内含子的切除需要在复杂剪接体的帮助下才能完成剪接过程(剪接体甚至是细胞中最大的分子复合物之一)。因此在长期的进化中,内含子的存在对细胞是有巨大负荷的。内含子对生物真正的意义,还有待于人们去发掘。而在设计基因表达框时,引入一些特别的真核生物内含子可以增加目的基因的表达量,这些内含子在转录起始位点的下游发挥作用。另外mRNA 的非翻译区 (UTR) 内存在多个调控元件,这对于 mRNA 的稳定性和蛋白翻译的效率也是非常重要的。譬如说 β-珠蛋白的5′-和 3′-UTR 可以明显提高翻译效率, α-珠蛋白的 3′-UTR则可以稳定mRNA,非洲爪蟾 β-珠蛋白 5′- 和 3′- UTR 、TEV的5′-UTR和人热休克蛋白 70 的 5′-UTR等同样被发现可以提高mRNA 的翻译效率等等。另外,在有些研究中,与内源性 miRNA 互补的靶序列也被整合到了表达盒里,这样可以起到在特定miRNA高表达的组织中“de-target”或抑制转基因表达的作用。

* (GSG) 残基可以添加到肽的 5′ 末端以提高切割效率

设计一个合格的基因表达框是一份可以很简单但又可以很复杂的工作,对不同组件的挑选、组合与改造,将会决定外源基因在目标组织中的表达量与表达时间。而AAV较小的外源基因承载空间,则给研究人员的发挥限制在了一个较小的舞台。如何在螺蛳壳里做道场,还是要靠科研人员针对不同的外源基因、靶组织进行case-by-case的尝试,这样才能开发出优质的表达框。

此外,所有蛋白表达框DNA序列都不是孤立的,必须构建到质粒骨架上(如AAV载体),与质粒骨架组成一个完整的闭环质粒,这对于DNA长期稳定的保存及后续的扩增生产都是至关重要的。

Gene-therapy innovation: Unlocking the promise of viral vectors

The past year revealed both successes and setbacks for viral-vector gene therapies. The rapid development and large-scale rollout of multiple adenovirus-vector vaccines represented an unprecedented achievement that is poised to help mitigate the devastating impact of the COVID-19 pandemic. During the same period, multiple high-profile gene-therapy assets encountered challenges, with clinical trials paused because of safety concerns or failing to meet efficacy targets.

These successes and setbacks are emblematic of the current state of viral-vector gene therapy: a technology with considerable promise but with a set of challenges still ahead. As more and more gene therapies have reached the clinic, it has become clear that multiple technological challenges must still be overcome to unlock the full potential of viral-vector gene therapy.

Rising to meet these challenges, biotech and pharmaceutical companies are testing a multitude of technological advances and innovative strategies that address all aspects of viral-vector gene-therapy development. For companies prepared to keep abreast of the rapid pace of change, these innovations offer a path for ushering in the next generation of viral-vector gene therapies.

The state of viral-vector gene therapy

Viral-vector gene therapies use modified viruses as drug-delivery vehicles to introduce specific DNA sequences—encoding genes, regulatory RNAs (for example, small interfering RNAs [siRNAs]), or other therapeutic substrates—into cells. The technology has long drawn interest for its potential advantages over traditional modalities. Many types of therapeutic agents (for example, enzymes, antibodies, and siRNAs) can be encoded in DNA sequences that can be rapidly designed and synthesized once a target is identified.

Viruses serve as powerful delivery vehicles for these sequences because of their ability to enter cells efficiently and potentially gain access to hard-to-reach, highly specific cells. In combining these features, viral-vector gene therapies can be used to modify gene expression in a programmable way, offering the flexibility to potentially treat a wide spectrum of diseases—including rare monogenic diseases by gene replacement and broad-population diseases by controlling gene expression—and help disease prevention by immunization.

Nearly all gene therapies currently available use one of three vector types: adeno-associated-virus (AAV) vectors, adenovirus vectors, or lentivirus vectors (Exhibit 1). AAV and adenovirus vectors are typically used in gene therapies that are directly administered to patients by infusion or local administration (in vivo), with AAV being the most popular vector for areas outside of oncology and vaccines. Lentivirus vectors are typically used for ex vivo therapies, in which cells harvested from a patient are modified in the lab before retransplantation. This article primarily focuses on in vivo gene therapies; however, many of the challenges and advances discussed are applicable across both routes of administration.

Excitement around viral-vector gene therapies is evident. While only four in vivo viral-vector gene therapies are currently on the market, more than 100 gene-therapy assets are in clinical trials as of late 2020, with a far greater number in preclinical development.

Many of these assets have emerged from the steady stream of small- and midsize biotech companies and academic labs supported by continued, high levels of venture-capital funding. Large pharma companies have increasingly focused on the potential of viral vectors, with seven biotech-company acquisitions valued near or above $1 billion in the past two years alone (Exhibit 2).1 Adenoviruses are being proven as a vaccine platform, with approvals for Ebola vaccines and groundbreaking COVID-19 vaccines over the past year.

While the high list-price of some gene therapies was once seen as a near insurmountable challenge to commercialization, innovative reimbursement strategies have shown that successful launches are possible, with ZOLGENSMA (treating more than 600 infants with spinal muscular atrophy3 in its first ten months on the market) beating analyst expectations.4 Worldwide sales of viral-vector gene therapies are forecast to grow at a rate of more than 50 percent year-on-year for the next five years (excluding the potential impact of COVID-19 vaccines), affecting the lives of tens of thousands of patients.

However, while there is significant momentum, there have also been multiple recent setbacks.5 Many of these relate to challenges previously outlined by McKinsey in its perspective on the future of gene therapy (including efficacy, durability, and manufacturing). As these therapies have sought to expand beyond the ultrarare indications they originally targeted, three technological challenges have emerged as recurrent obstacles. For viral-vector gene therapies to reach their true transformative potential—much like monoclonal-antibody technology 20 years ago—this set of technological challenges must be overcome.

Challenges to realizing the potential of viral-vector gene therapies

The current generation of viral-vector gene therapies represents the culmination of decades of biological and clinical research. As more patients have received these therapies, it has become clear that three fundamental challenges will restrict the applicability of viral vectors: getting past the immune system, lowering the dose, and controlling transgene expression. Ongoing work to address these challenges is generating technological innovations that have the potential to leapfrog current therapies and unlock the potential of viral vectors.

1.Getting past the immune system

The success of any viral-vector gene therapy depends on its ability to get past multiple lines of defense deployed by the human immune system. Viral capsids, viral-vector DNA, and even the transgene products themselves may be recognized as foreign, providing multiple opportunities for the immune system to clear the gene therapy from the body.

Immunity against viral capsids can limit the efficacy of a gene therapy. Because most viral-vector gene therapies today use vectors derived from harmless viruses circulating in humans, many patients (up to 60 percent) may have preexisting immunity from past exposure.6 CanSinoBIO, for example, reported reduced efficacy of its COVID-19 vaccine in individuals with preexisting antibodies to the adenovirus-5 (Ad5) vector it chose for drug delivery.7
Although this effect depends on the vector serotype used, and the clinical impact is still unclear,8 many clinical-trial sponsors conservatively exclude patients from their studies if they have antibodies to the vector in question. This can come at the cost of making most patients ineligible for therapy. Acquired immunity to viral vectors poses additional challenges for viral-vector gene therapy in the long term. Patients treated with a gene therapy today may not be able to receive a second gene therapy in the future if the same viral vector is used in both contexts.

In addition, viral capsids and viral-vector DNA can actively provoke an immune response from the body. For viral-vector vaccines, this immunogenicity can be beneficial, as it reduces the need for adjuvants and increases efficacy. However, for other viral-vector gene therapies, immunogenicity can reduce efficacy, increasing the chance that the gene therapy is detected and eliminated by the immune system. Indeed, some have speculated that immunogenic vector DNA sequences are behind the limited durability of some recent gene therapies, leading to their abandonment.9 More concerningly, immunogenicity can lead to safety concerns during therapeutic use, as high levels of viral capsids can cause severe immune reactions at the time of injection.

Unraveling the immune system’s intertwined responses to viral-vector gene therapies remains difficult. Animal models do not recapitulate all relevant aspects of the human immune system (as immune systems behave quite differently among species). While human clinical trials offer a valuable source of insight, many gene-therapy trials are too small to confidently isolate the parameters associated with a drug’s success or failure.

2.Lowering the dose

Current viral-vector gene therapies require the administration of large numbers of viral particles to patients, particularly for therapies aimed at treating systemic diseases. For example, recent gene therapies for Duchenne muscular dystrophy (DMD) that aim to correct mutations in muscle cells throughout the body have delivered up to approximately 10^16 (ten-thousand trillion) viral particles in a single dose (for example, a dose of 3 × 10^14 vector genomes [vg] per kilogram [kg], assuming a 30-kg child),10 which is multiple times the number of cells in the human body.11 For systemic diseases, the need to individually target and repair many cells in the body partly explains why such large doses are administered. Another explanation is the limited cell-type specificity of current viral vectors: large numbers of viral particles must be delivered to ensure that an adequate number reach clinically relevant cells.

The large doses used in current gene therapies pose two challenges. First, large doses are difficult and expensive to manufacture. Today, a typical manufacturing run of an AAV-vector therapy using high-yield cell lines and large-capacity bioreactors might only produce approximately ten doses of a systemic gene therapy from a single batch at a cost of nearly $100,000 per dose (assuming approximately 1 × 10^17 vg per batch).12 Although these costs will gradually decrease as gene therapies begin to reach clinical and commercial scales, any technological advance that reduces the required dose would bring immediate benefit, as a tenfold reduction in dose might also bring about a tenfold reduction in costs.

Second, and even more critically, administering large doses of virus has been linked to adverse safety outcomes.13 Although investigations of four deaths in clinical trials of AAV-vector therapies in 2020 are ongoing, three deaths occurred in high-dose cohorts. Clinical-trial protocols have subsequently been revised to limit viral dosage, reflecting the tremendous importance of this issue.[14]

3.Controlling transgene expression

Once a viral vector successfully delivers its therapeutic gene to the cells in question, the efficacy of the gene therapy depends on the quality of transgene expression. Specifically, the transgene must be expressed at the appropriate level (neither too low nor too high), in the appropriate cells, and for the appropriate duration to mediate the desired clinical effect. For therapeutic uses (in contrast to use for vaccines), the transgene may need to be expressed permanently if the gene therapy is to serve as a one-time cure and represent an appealing alternative for patients over current standards of care requiring repeated dosing (which may not be possible because of the challenges previously laid out). Regulators have required multiple years of follow-up data showing that gene expression is maintained. Indeed, some drugs have been abandoned when expression waned after 12 months.

To maximize chances of success, early viral-vector gene therapies have opted to include regulatory elements (DNA sequences such as promoters and enhancers that control how genes are expressed) that have been selected to drive high levels of transgene expression in all cell types. However, this approach may have significant drawbacks, particularly as gene therapies move beyond gene replacement for monogenic rare diseases. Overexpression of the transgene or its expression in the wrong cells may contribute to inflammation and other toxicities (as was observed in recent studies of nonhuman primates).15 Moreover, current gene therapies, once administered, cannot be controlled or turned off by clinicians should the need ever arise.

Innovative solutions that address gene-therapy challenges from many angles

To tackle the challenges facing gene therapy, academic labs, start-ups, and established companies are generating myriad innovative solutions (Exhibit 3). Each focuses on a specific component of a gene-therapy product (for example, the viral capsid) or part of the development process (such as manufacturing). However, these innovations often address multiple core challenges, outlining multiple paths to realizing the promise of viral-vector gene therapy.

We have identified five key trends to watch.

1.Improved capsids
The viral capsid is a critical component of viral-vector gene therapy. It determines which cells are targeted, the efficiency of cell entry, and the probability that the gene therapy is detected and eliminated by the immune system. In addition, the capsid is largely responsible for the stability of the viral vector during the manufacturing process and can affect storage and distribution requirements.16

The capsids most widely used today, including those used in on-market products, are derived from naturally occurring viruses. They have suboptimal properties, including little cell-type specificity, moderate efficiency of cell entry, and relatively high levels of preexisting immunity in humans. To address the problem of preexisting immunity, many assets use capsids from viruses found in other species. For example, the AAV8 and AAVrh74 capsids used in multiple AAV-vector gene therapies are derived from AAV serotypes isolated from macaques, and some of the COVID-19 vaccines that have been developed have used adenovirus serotypes from chimpanzees and gorillas. While this approach may limit the challenges of preexisting immunity, it largely doesn’t address specificity or efficiency (particularly as these viruses have evolved to infect nonhuman species).

Increasingly, drug developers are turning to capsids that have been engineered in the lab and can be selected to overcome the challenges mentioned previously (Exhibit 4). These engineered capsids are identified through large-scale screening efforts in which millions of variant capsids are screened for the desired properties and iteratively refined. Capsid-engineering platforms—many of which have been spun out of academic labs to form companies—achieve these ends by leveraging advanced technologies, such as cryo-electron microscopy (cryo-EM) and artificial intelligence.

Improving capsid properties could bring multiple immediate benefits. For example, a twofold increase in a capsid’s cell-type specificity could enable a twofold decrease in the overall viral dose required, thereby improving safety and cost. It’s still too early to determine the true impact of capsid engineering, as most engineered capsids are still in preclinical development. However, companies’ early reports suggest that capsids with five- to tenfold improvements in multiple attributes may be entering the clinic soon.

2.Improved vectors
Like the capsid, the DNA sequence of the viral vector itself affects multiple aspects of a gene therapy’s performance, but engineering the vector can often be considerably easier, cheaper, and quicker. Accordingly, vector engineering is becoming a growing focus of gene-therapy R&D. Vector engineering is often easier with adenovirus and lentivirus vectors than with AAV vectors because of AAV’s inability to package large pieces of DNA. However, innovative vector elements are beginning to appear in AAV-vector designs as well.

Vector engineering broadly has two aims: reducing the immunogenicity of the viral vector and improving transgene expression. One strategy to achieve both aims is codon optimization, in which variations in the vector sequence are explored to eliminate immunogenic sequence motifs while optimizing the transgene for robust expression. Subtle changes in vector sequence achieved through codon optimization can have large effects, such as increasing expression levels and possibly extending the duration of expression for multiple years.[17]

Transgene expression can be further programmed by engineering regulatory elements into the vector sequence. Some regulatory elements turn on transgene expression only in certain cell types or tissues—ideally, the disease-causing cells—preventing potentially toxic expression in other contexts. Such cell-type- or tissue-specific regulatory elements (for example, promoters and enhancers) have become relatively common in viral-vector gene therapies. For an additional layer of control, some viral-vector gene therapies are also incorporating regulatory elements, such as microRNA-target sites, that reduce expression in specified cells—for example, in cells that promote an immune response.

Finally, a more distant and challenging goal is to engineer vectors that are inducible, where transgene expression can be controlled using an additional signal, such as an orally administered small-molecule drug. This could allow clinicians to turn on, turn off, or otherwise adjust a gene therapy after it is administered, delivering a personalized course of treatment.

3.New types of cargo

The cargo delivered by a viral-vector gene therapy is typically a working copy of a gene that is used to replace the patient’s disease-causing copy of that same gene. However, any therapeutic agent that can be encoded in DNA can theoretically be delivered by a viral vector. Researchers and drug developers are increasingly leveraging this flexibility to deliver other types of molecules with therapeutic value—alone or sometimes in combination—including regulatory RNAs (for example, short hairpin RNAs [shRNAs]), vectorized antibodies, and substrates for gene editing.

Gene editing is an intriguing potential solution for achieving long-lasting, physiologically appropriate gene expression. For patients with diseases caused by certain types of mutations, restoring the function and expression of the patient’s own copy of the gene through gene editing may be simpler (and more permanent) than attempting to engineer and deliver a replacement.

4.Improved manufacturing processes

Early gene-therapy-manufacturing processes originated in academic labs and were focused on small, research-scale batches. These processes were not optimized for moderate- or large-scale production or for the delivery of systemic therapy. As gene therapies start to expand outside the treatment of ultrarare diseases, one of the many challenges being addressed is the presence of empty capsids created during the manufacturing process. These empty capsids, which have no active cargo, can create the requirement for higher doses and, accordingly, stimulate stronger immune responses.

Two approaches are being developed to reduce the ratio of empty-to-full capsids in manufacturing: developing improved methods to separate the empty from full capsids based on specific properties (for example, charge and molecular weight) and engineering cell lines that package full capsids more efficiently. By reducing the empty-to-full ratio, these advances reduce manufacturing costs, reduce immune responses, and improve the safety of gene therapy. Indeed, regulators have used reducing the empty-to-full capsid ratio as part of the rationale for lifting clinical holds on gene-therapy products with previous safety issues.[18]

5.Improved pretreatment and conditioning regimens

Beyond engineering the capsid and vector, a separate approach for reducing the immune system’s detection of viral-vector gene therapies involves coadministering the therapy with an immunosuppressive agent. Multiple such conditioning regimens are currently being tested to reduce the impact of neutralizing antibodies on the efficacy of the treatment, both of preexisting antibodies and newly generated antibodies that could prevent future redosing. Nearly all current viral-vector gene therapies use steroids to help manage the potential immune response to the viral vector; however, the type, dosage, and timing of the steroid treatment varies widely.

Some clinical trials are experimenting with more targeted immune suppression, such as the use of rituximab to reduce the creation of memory B cells.19 An even greater assortment of approaches is being tested in animal models to directly reduce the presence of neutralizing antibodies. These include the use of enzymes cleaving to immunoglobulin G (IgG), plasmapheresis to remove the neutralizing antibodies specific to the gene therapy, and even CRISPR-based repression of neutralizing-antibody creation.20 These approaches could expand the pool of eligible patients to include those with preexisting immunity. Moreover, these approaches could enable a patient to receive multiple doses of the same therapy or of different therapies using the same vector backbone.

The road ahead

Viral-vector gene therapies find themselves at another inflection point. Early successes in the treatment of rare diseases and vaccines have proven the potential of this modality, while the challenges to gaining widespread adoption—the way that monoclonal antibodies have over the past 20 years—have only become clearer. Nevertheless, the wealth of innovative solutions being explored across academia, biotech, pharma, and contract development and manufacturing organizations demonstrate that viral-vector gene therapies are here to stay.

As described previously, different solutions are emerging to address each of the core challenges. The diversity of these approaches and the complexities of gene therapy mean that no single approach is likely to “win.” That situation will enable a rapid innovation cycle in which gene therapies are constantly being improved upon, which will offer new opportunities to leapfrog existing products. Even as AAV-vector-based delivery is becoming the leading technology, some prominent limitations combined with the rapid pace of innovation leave the door open for other delivery technologies to emerge.

Owners of viral-vector platforms will need to consistently look to the next set of innovations beyond their current platforms and assets. That could include investing directly to help overcome the broader challenges or buying or licensing critical technology to upgrade their platforms. Indeed, multiple new biotech companies have launched to solve one or more of the challenges outlined in this article as a service to developers of gene therapies. Staying abreast of these developments will require fastidious monitoring of scientific and technological progress on all fronts. However, since it is difficult at this early stage to place bets across all potential solutions and innovators, gene-therapy leaders will need to make their investments judiciously.

In the short to medium term—while technological challenges limit the scope of gene therapies to curative treatments for rare diseases—fast followers may find it difficult to be successful, even with improved technologies, as first entrants rapidly address prevalent populations. Gene-therapy leaders will therefore need to strike a careful balance by accelerating programs today while retaining the flexibility to adopt innovative technologies that unlock treatments for broader-population diseases and the full promise of viral-vector gene therapies in the long term.

https://www.mckinsey.com/industries/life-sciences/our-insights/gene-therapy-innovation-unlocking-the-promise-of-viral-vectors

Circular RNA Translation

Definition
A new RNA family has emerged, circular RNAs (circRNAs), generated by a process of backsplicing. CircRNAs have a strong impact on gene expression via their sponge function, and form a new mRNA family revealing the pivotal role of 5′ end-independent translation. CircRNAs are translated into proteins impacting various pathologies including cancer and neurodegenerative diseases, and are key players in aging. RNA circle translation also provides many perspectives for biotechnological and therapeutic applications.

Introduction
The potential of circular RNA to be translated has been studied since the 1970s. In 1979, an experiment was designed to determine the ability of circular mRNA to attach ribosomes [1]. A synthetic RNA was circularized with T4 RNA ligase and the binding of bacterial 70S ribosomes versus wheat or rabbit 80S ribosomes was assessed, showing that only the prokaryotic ribosomes were able to attach to RNA circles while the eukaryotic ribosomes were not. This demonstration supported the hypothesis of a ribosome scanning mechanism depending on the RNA 5′ end to explain initiation of translation in eukaryotes. According to this model, the 40S ribosome small subunit was expected to be recruited only at the mRNA capped 5′ end [2]. Consequently it was thought that eukaryotic ribosomes were unable to initiate translation by internal entry, rendering impossible the translation of circular RNA.

Ten years later, the discovery of translation initiation mediated by internal ribosome entry sites (IRESs) broke the rule [3][4][5]. Furthermore, the presumed inability of eukaryotic ribosome to bind circular RNA was contradicted in 1995: artificial circular RNA containing an IRES was generated [6]. The authors observed a significant translation of circular RNAs containing the IRES of encephalomyocarditis virus (EMCV). This work definitely demonstrated two main points in contrast with earlier suggestions (i) the 40S ribosomal subunit is not necessarily recruited at the mRNA 5′ end but can be recruited internally onto an IRES, and (ii) a circular RNA can be translated.

Despite these demonstrations, IRES function in cellular mRNAs remained questioned for a long time, although obvious in the case of picornaviruses whose genomic mRNAs are uncapped [7][8]. From here on many studies have demonstrated the role of IRESs to permit translation of specific classes of capped mRNAs when the cap-dependent initiation mechanism is blocked, which occurs during stress [7][9]. The IRES-dependent mechanism has now revealed its crucial role in the translational response to stress and is regulated by specific proteins called IRES trans-acting factors (ITAF) [3]. IRESs are also responsible for an increased translation of these mRNAs in cancer cells, a process related to abnormal rRNA modifications [10]. Covalently closed RNA circles resulting from splicing were identified at the beginning of the 1990s and were first considered as aberrant splicing products [11][12]. More than 20 years later it appears that hundreds of human and animal genes express circular RNA isoforms called circRNAs [13]. They are post-transcriptional regulators and in several cases they are translated, mostly via IRESs [14]. Translation of cellular circRNAs thus provides full physiological relevance to IRES-dependent translation.

CircRNAs may also be translated by another cap-independent mechanism mediated by the methylation of the nitrogen at position 6 in the adenosine base within mRNA, N6-methyladenosine (m6A) [14][15]. M6A is a reversible epitranscriptomic modification found in many eukaryotic mRNAs [9]. When present in the 5′ untranslated region (5′UTR), a single m6A promotes cap-independent translation at sites called “m6A-induced ribosome engagement sites” (MIRESs) [16]. As IRESs, MIRESs stimulate selective mRNA translation in stress conditions by a mechanism involving direct binding of the initiation factor eIF3. Translation of circRNAs definitively put an end to the debate about 5′ end requirement and IRES existence in cellular mRNAs [8][17]. CircRNAs form a new class of mRNAs whose stability is far more important than that of their linear counterpart.

In parallel to the studies on covalently closed circular (CCC) RNA, a series of reports have shown that translation involves the functional circularization of mRNA. Already in the 1980s circular polysomes were observed by electron microscopy [18]. It was demonstrated a few years later that the mRNA 3′ untranslated region (UTR) is functionally interacting with the 5′UTR via the interaction of PABP with eIF4G [19][20]. The model of functional circularization involving eIF4G as a ribosome adapter was quickly adopted [21][22]. This mechanism involves both cap-dependent and cap-independent translation, as eIF4G can bind to the mRNA via IRESs independently of the cap-binding factor eIF4E [23]. The closed-loop phenomenon promotes ribosome recycling and thus enhances translation. Functional circularization of mRNAs occurs through several mechanisms in addition to interaction of PABP with eIF4G and appears as a pivotal parameter.

Can we still consider an mRNA as linear? That is the question.

Circular RNAs, from the Artefact to a New Gene Family
The first RNA circles were observed in 1976 by electron microscopy in viroids (plant pathogens), then in 1979 in human HeLa cell cytoplasm [24][25]. More than 10 years later in the 1990s the existence of such circles was confirmed and attributed to a scrambled splicing process, using the acceptor site of an exon located upstream of the donor splice sites [11][12]. The authors described the first cases of circular RNA generated from pre-mRNA processing, but the biological significance of such RNA molecules remained questioned. Today we know that these studies described what is presently called backsplicing [14].

Shortly after, a circular transcript was identified after RNase H digestion of RNAs extracted from adult mouse testis as the most abundant transcript expressed from the Sry sex determination gene [26]. This transcript specific to adult testis shows a cytoplasmic localization and a strong stability despite the absence of cap and poly(A). The stability of RNA circles was not a surprise as they do not give access to exoribonucleases. Such a stability had been observed previously for the circular RNA genome of the hepatitis delta virus, as well as for plant viroids and virusoids [27][28]. A long open reading frame (ORF) was detected in the Sry circular RNA. The authors made the assumption that it could have either a positive role by being translated by internal ribosome entry or a negative role as a noncoding RNA by preventing efficient translation [26]. When suggesting a link with translation, the authors were in the right direction: twenty years later Sry circRNA has been shown to function as a sponge for the microRNA miR-138 with 16 putative sites for that miRNA [29]. Sry circRNA thus indirectly acts on translation by preventing translational inhibition of miR-138 targets involved in activation of tumor cell growth and invasion [30].

In the last decade, the emergence of RNA deep sequencing technologies and of sharp bioinformatics analyses has generated a major leap forward in the field of circRNAs. The abundance of the circular transcript observed for Sry in 1993 turned out to be a general feature for thousands of genes in human and mouse tissue and in various cell types [13][31]. RNA-seq analyses revealed that many scrambled splicing isoforms are expressed at levels comparable to that of their linear counterparts. The circular status of these scrambled isoforms was demonstrated using RNase R, a 3′–5′ exoribonuclease that degrades all linear RNA molecules. Most circRNAs are located in the cytoplasm. The expanded landscapes of circRNAs have been determined by RNA-Seq in 44 tissues of human, macaque and mouse, revealing 104,388, 96,675 and 82,321 circRNAs from the three species respectively [32]. Initially considered as splicing background noise, circRNAs constitute according to the current studies 20% of the top 1000 most abundant transcripts in human and macaque tissues while only 8% in mouse tissue. In human tissue, 61% of the coding genes express at least one circular transcript. All these reports demonstrate that expression of circRNAs is far from being an epiphenomenon.

CircRNAs exhibit different modes of action, depending on their composition which itself affects their localization. CircRNAs that contain intronic (called ciRNAs) or intronic plus exonic sequences (EIciRNAs) are nuclear and mainly regulate the expression of their parental gene. EIciRNAs have been shown to interact with RNA polymerase II subunits, with U1 snRNP and with the parental gene promoter where they behave as transcriptional enhancers [33]. Another study has shown that circRNA expression can influence the splicing of the parental gene by competing with canonical splicing [34]. The third class of circRNAs, composed of exonic sequences exclusively (ecRNAs), are cytoplasmic and act via two types of mechanisms: on the one hand they act by sponging miRNAs or RNA binding proteins (RBPs), on the other hand they can be translated [14][35].

Translation of circular RNA has demonstrated its relevance in many diseases [84,85]. Several circRNA products are involved in cancer [49,50], while the deregulated expression of circRNAs acting as sponges or being translated is involved in neurodegenerative diseases. CircRNAs appear as key players in aging [88,89].

Future Perspectives for Biotechnological and Therapeutic Applications of RNA Translation in Circles
The emergence of circular RNAs, much more stable than their linear counterparts, opens a new avenue for protein production in biological systems and development of therapeutic vectors. In view of the stability of circular RNA one can envisage cell transfection by circular RNA produced in vitro. The challenge of optimizing such a vector resides in its translation efficiency. The study by Wesselhoeft et al. has pioneered the use of exogenous circRNA for robust and stable protein expression in eukaryotic cells [36]. These authors have engineered a technology of circRNA production for potent and stable translation in eukaryotic cells, based on self-splicing by using a group I autocatalytic intron. They found that the most efficient intron is that of Anabaena pre-tRNA while the optimal IRES is the Coxsackievirus B3 (CVB3) IRES. The efficiency of the IRES is however cell-type-dependent. Such circRNAs containing the luciferase reporter ORF were produced by in vitro transcription and purified using high-performance liquid chromatography (HPLC). They were then used for transfection of human cell lines, revealing that the circRNA produces 811% more protein than the corresponding capped and polyadenylated linear RNA. CircRNA exhibited a protein production half-life of 80–116 h, compared to 43–49 h for the linear counterpart. These authors reported that circRNAs are less immunogenic than linear RNAs [37]. Synthetic circRNAs were also produced by simple ligation of in-vitro-transcribed linear RNA molecules containing microRNA binding sites [38]. Such sponge circRNAs, containing miR-21 binding sites, were shown to suppress proliferation of three gastric cell lines. It should be noted that synthetic circRNAs containing m6A modifications instead of the IRES failed to produce any translation product, suggesting that m6A-mediated translation would require the binding of nuclear RBPs [37].

In another contribution, Meganck et al. designed a recombinant adeno-associated virus (rAAV) vector expressing a circRNA coding GFP under the control of the CMV promoter, with the EMCV IRES to drive initiation of translation [39]. Vector intravenous delivery into mice demonstrated a robust transgene expression in cardiac tissue as well as in brain and eye tissue while expression was less efficient in liver tissue. This was attributed to the EMCV IRES but might also result from the weak activity of the CMV promoter in liver. The above studies demonstrate that IRESs drive the efficient production of proteins from circular RNA-producing vectors but also underline the sensitivity of IRESs to the cellular context. In future applications, the choice of IRES and promoter may be adapted according to the targeted tissue and it will be of particular interest to test cellular IRESs rather than only viral IRESs in such vectors, as these IRESs are often tissue-specific in vivo [40][41].

A recent study has developed a cell factory for recombinant protein production in Chinese hamster ovary (CHO) cells, based on rolling-circle translation [42]. Cells were transfected with a plasmid containing the sequence of human erythropoietin (EPO) ORF flanked by adequate splicing sites to obtain a circRNA. The EPO ORF was made infinite by removal of the stop codon which was replaced by a 2A element to obtain a ribosome “stop-go” process (and not a cleavage as mentioned in many publications) [43]. The 2A-mediated stop-go drives immediate reinitiation through ribosome skipping and prevents the formation of multimers. Costello et al. showed that the EPO coding “infinite” circular mRNA improves the production of secreted EPO compared to linear mRNA or circRNA with a stop codon. Another original approach is to produce ribozyme-assisted circRNAs (racRNAs), in the so-called “Tornado” (Twister-optimized RNA for durable overexpression) expression system [44]. The “Tornado” transcript is flanked by two Twister ribozymes that undergo autocatalytic cleavage and generate termini that are ligated by the endogenous RNA ligase RtcB. racRNAs containing protein-binding aptamers were successfully expressed in different mammalian cell types. In particular, the NF-kB pathway was efficiently inhibited by this way. RacRNAs might also be useful to express proteins of interest if containing an ORF. Altogether, these different studies provide numerous perspectives for a new generation of gene therapies [45]. Synthetic circRNAs, plasmids or viral vectors expressing circRNAs offer an exciting perspective to expression of genes of interest and also combinations of therapeutic genes that could be translated either with IRESs or by rolling-circle translation with 2A elements.

This entry is adapted from 10.3390/ijms21228591

References
Kozak, M. Inability of circular mRNA to attach to eukaryotic ribosomes. Nature 1979, 280, 82–85.
Kozak, M. How do eucaryotic ribosomes select initiation regions in messenger RNA? Cell 1978, 15, 1109–1123.
Godet, A.C.; David, F.; Hantelys, F.; Tatin, F.; Lacazette, E.; Garmy-Susini, B.; Prats, A.C. IRES Trans-Acting Factors, Key Actors of the Stress Response. Int. J. Mol. Sci. 2019, 20, 924.
Jang, S.K.; Krausslich, H.G.; Nicklin, M.J.; Duke, G.M.; Palmenberg, A.C.; Wimmer, E. A segment of the 5’ nontranslated region of encephalomyocarditis virus RNA directs internal entry of ribosomes during in vitro translation. J. Virol. 1988, 62, 2636–2643.
Pelletier, J.; Sonenberg, N. Internal initiation of translation of eukaryotic mRNA directed by a sequence derived from poliovirus RNA. Nature 1988, 334, 320–325.
Chen, C.Y.; Sarnow, P. Initiation of protein synthesis by the eukaryotic translational apparatus on circular RNAs. Science 1995, 268, 415–417.
Holcik, M.; Sonenberg, N. Translational control in stress and apoptosis. Nat. Rev. Mol. Cell Biol. 2005, 6, 318–327.
Shatsky, I.N.; Terenin, I.M.; Smirnova, V.V.; Andreev, D.E. Cap-Independent Translation: What’s in a Name? Trends Biochem. Sci. 2018, 43, 882–895.
Lacerda, R.; Menezes, J.; Romao, L. More than just scanning: The importance of cap-independent mRNA translation initiation for cellular stress response and cancer. Cell. Mol. Life Sci. 2017, 74, 1659–1680.
Marcel, V.; Ghayad, S.E.; Belin, S.; Therizols, G.; Morel, A.P.; Solano-Gonzalez, E.; Vendrell, J.A.; Hacot, S.; Mertani, H.C.; Albaret, M.A.; et al. p53 acts as a safeguard of translational control by regulating fibrillarin and rRNA methylation in cancer. Cancer Cell 2013, 24, 318–330.

离开博后:合适的时机,合适的转身

*背景

国内排名前15学校本科毕业后出国,因为GPA什么的也没有准备的特别好,来美国二三线州立大学做博士。

博士导师人很不错,乡下,05年也给出22k的工资,生活还是可以过的。虽然五年后毕业也欠了几千刀。博士项目相对比较交叉学科。我可以选主要做wet lab也可以选主要做计算。选了主要做bench但是还是做了很多bioinformatics有关的工作,选修了一下可能10-20学分的bioinformatics的课程。

博士期间比较productive,发了八九篇文章,当然不是都是一作。博士导师私人人脉一般,虽然也算是业界天牛家族体系里出来的。导师总体很支持我的发展,但是毕竟能力有限,也不能帮太多。

*第一个博后

毕业前找博后,觉得自己文章数量多,虽然IF一般,但是觉得应该问题不大。确实拿到几个面试,说实话都是一般的实验室。大牛实验室,没有CNS级别的文章或者自带经费,大家都知道是很难进去的。最后选了一个竞争不是很激烈,做了就能出结果的领域,在一个niche但是是这个领域很知名的研究所。面试的时候和老板谈得很好,觉得她懂得很深刻,对职业发展可能很有帮助。这个老板也给了很多promise,比如会给很多学术自由等等。

刚做了几个月,就不对劲。简单的总结,这个老板是control freak和micromanager。许诺的学术自由其实就是空话。感觉有personality disorder,常见的例子比如,你随便去选你想去的conference吧。选了两个又给我全盘否定,都不好不准去。实验室其实有很多问题,我不得不发声。比如设备,仪器,准确度有问题,需要矫正等,居然都要我发现。我是新入门,其他实验室做这个领域很久的。所以大概就把自己的名声毁了,因为问题都和我有关。不到半年就觉得需要换实验室,我就赶快又开始投。

很快拿到了三个面试的样子。实际上感觉自己面试能力还是不错的,所有面试过的都拿到了。最后选择了一个一年前面试过,但是当时她没funding但刚刚拿到funding的实验室,在牛校附属医院。觉得牌子响,这个老板也发过很多中等偏上的文章,在我可选择范围内应该是最佳选择。大约在一年合同到期前三个月,老板提出因为三点原因,我应该找新的实验室。其实老板人还是不错的,她分析的三点原因,都不是说我本身工作有什么问题,而完全就是我个人觉得必须走的三个原因的翻版。这个时候我已经有了下家,所以情绪也很稳定很欣然的说好的。但是我走的时候也没有给她说我去哪里了,就说了去哪个城市。最近看她网页居然不久前把这个城市改成了学校名字。看来被谁google了。在这里有一篇IF10的挂名文章。其实这个实验室是我呆过实验室出CNS和其他高IF文章最多并持续出的实验室。能上这些杂志一定原因是领域的重要性和研究者的稀少。我本来是希望自己能靠这个当上教授的。而且刚走就看到一个不错的学校招AP,要求的经历和我原本希望进行的研究内容几乎完全相同。

结论:第一个博后失败。

*第二个博后

第二个博后的前两年是很不错的。我接手一个项目,新的模式生物,也可以做基础临床数据研究。所以是充分利用我之前的training了。因为老板对这个项目并不是很了解,不算真的专家,所以前两年我可以比较自由,虽然有点压力(项目每个季度要给报告,老板经常很紧张),但是总的来说我还是很enjoy这个科研的过程。

研究的进度总的来说比较慢,因为我后来发现之前一个博后挑了数据来发表,但是他之前大部分试验结果和我的结果是一样的。但是直到今天,老板也不愿意正面面对这个事实,并威胁我说我说的是“非常严肃的指控”。我说我只是摆数据和事实给你看。但是因为有些重要实验进度不佳,所以情况也越来越恶化。到目前有一篇业内专业排名第一的第一作者文章,和一篇小领域专业杂志署名作者一篇。最可惜的是老板根本不喜欢听我的新idea,刚刚除了两篇还不错的文章,在一定程度上把我两年多以前给她提出的一个idea给综合起来scoop了。虽然我们做得了的话也可以发表并且冲突并不是很大,但是还是很可惜。

到现在,第二个博后做了超过四年,累计博后已经五年。我是不想再做了。第三年的时候就开始盘算一定要按期结束这个博后。本实验室最近走的三个博后分别是在实验室呆了11-12年,10年和8年。非常的不好。有些人是走得快,但是除了一个精明的呆了一年跳到大牛实验室现在坐上了名校一附属医院AP,其他大部分都没有能继续在美国从事AP以上的学术道路。

第四年的时候就积极研究自己下一步怎么走。手上的项目感觉有希望变成文章,但是实验室科研氛围每况愈下,老板自己不思考,不了解领域情况,很多时候我们都要浪费很多时间温习老数据,反复争论一些早就该下了定论的东西,讨论过老板经常很快也忘了。而且这个问题不单是在我身上,所有博后都是同感。

于是开始积极参加博后协会等开展的各种职业规划讲座和参加俱乐部。之后开始读一些网络课程希望加强自己的简历。学了一些data science的东西,希望能往这个方向去发展。后来确实收到过一些recruiter的信,但是通常发了简历也没能拿到面试。

最接近成功的一次是政府研究机构的一个contractor PI职位。Recruiter非常喜欢我的简历,也认为我是最强之一。确实是的,我从未见过一个工作是我可以把每一项要求都打上勾的。而且,如果没有我博士和博后的经历加起来,我也不能把每一条都打上勾。据说,project manager说研究所是很喜欢我的简历的。在快要拿到面试的时候,可能因为政府已经花了差不多半年来准备fill这个职位,政府突然决定内部调一个人去,称可以节约资金。所以这个position就很唐突的关掉了。这也是我为什么觉得这事天意:一来我从未见过这么匹配的工作,二来即使是这样的我也拿不到面试, 所以真的是该
跳出火坑了。

*未来

在第四年我想过很多。给自己的规划也是有不同的plan A/B。因为自己的计算部分的经历至少是吸引了一下recruiter,觉得往这方面加强应该有所帮助。所以开始学网络课程,并研究有什么master课程只需要一年即可增强自己的可聘用度,并增加自己可以投简历的职业范围。年中之后准备考GRE,并下定决心要申请MPH,可以增强自己健康/医疗/生物数据分析的能力。申请也不敢要老板的推荐信,不过最后还是凑齐了三封。

申请截止之后,和很多之前的同学朋友电话聊了聊。有不少质疑我为什么要申请这个master。也有人认为申请这个不如申请MBA。我想了想,因为自己在这一年积累的“课外活动”,外加很好的GRE分数(相当于770的GMAT),我想我不如试试吧。研究之后发现一些学校也有MPH/MBA的双学位。于是就申请了。时间有点仓促,决定申请的时候距离截止不到三周。

现在又快到了415,我的申请结果也都出来了。我申请的都是排名前十的学校(eitherMPH or MBA)。申请到一个MPH/MBA,杯具一个MPH/MBA,一个拒了我的MBA但是给了MPH,一个单独的MBA把我拒了,一个MPH的录取,另外分别拿到一个学校的MPH和MBA但是不能同时读,只能二选一。

我现在已经从了一个top MBA项目,虽然读下来会负债up to 10w,但是我想95%以上的可能是值得的。拿到最想去的MBA项目的offer之后第二天,约老板谈职业规划,因为我们每年按理都需要谈一次。我说,去年我们谈的时候,我说我对咨询有兴趣 (当时老板说你没有足够的expertise当不了consultant,你需要更多文章,LOL),但是我现在对生物技术公司,和生物startup的商业发展感兴趣,“您怎么看?”。Clarify了一下这是什么意思之后,老板说,我认为你这个想法是“幼稚(naive)”的。她说startup经常失败,并不一定能继续拿到funding,那么失败了你怎么办呢?你有足够的资历吗?你应该在实验室多发文章,这样你以后出去进公司起步就高。之后我说我想知道如果要走我们是怎么样的过渡?老板认为我来她实验室就有一个commitment,必须把所有的项目做完,文章投出去才能走。如果“别人来问我”,你没有做完就走,我不能告诉他们你是productive。也就是说威胁用推荐信卡我,并多次说“你要想清楚”。老板拒绝给出一个时间或checklist,追问之下说,你这是hypothetical还是已经有确凿的选择?我说我只是想早点开始这个conversation,因为过程会很复杂。我也是摸底她的态度,来决定给她多少时间。之前实验室有个中国人呆了很多年,也警告我说,他觉得他之前有三个工作没拿到大概是老板推荐信不好,最后拿到的工作也是没有要老板的推荐信。老板还说,你现在都不需要去探索外面工作的机会,你只需要专心发文章,外面工作机会会越来越多。她真当我是小学生这么好忽悠吗?

第二天,我们实验室有个准备跟随老公回国的女生,也被老板告知你不做完不能走。虽然她从一开始就给老板说的很清楚,因为家庭原因不会在实验室呆很久,并早就计划可能在今年年底回国(不是中国)。我和老板谈的时候,也是引用她和老板的职业规划对话,来要求一对一的讨论。老板也想从她那里打探我和这个女生讨论了些什么。

所以,我的结论就是,做博后,浪费青春的概率是很大的。但是利用这个时间来积累职业规划的下一步是很重要的。可能很多人进入博后都会幻想当AP,并不是说肯定当不了,但是大家一定要realistic,并且有plan B,plan B也必须尽早积累和实施。绿卡一定要早申请,没有的话进industry都没可能。很多(不是所有)老板必然是不在乎我们的职业规划和发展的,他们只会要求更多的paper,写更多的grant,给他们奉献更多的idea,他们认为我们在他们实验室干八年十年都是应该的,我们永远都不会ready去下一步。

希望各位都能找到自己的path,尽早独立。

如何在面试中做一个有趣的人?

在国外的面试中,不论是学校面试还是工作面试,面试官都很关注面试者的personality,即性格。实际上就是在于看你是不是一个有趣的人。
很多中国人对此不太理解,面试中显得有趣有什么用?对于中国人来说,大家更讲究一个人是不是务实。如果一个人在面试中表现得过于活跃或有趣,往往容易被认为性格张扬,反而是一个缺点。

但是在国外,尤其是美国的面试环境中,大家喜欢看一个人是不是有趣。
要知道,很多工作需要团队合作,跟有趣的人一起合作,会让你的工作也变得有乐趣。Have fun(享受乐趣)在美国是一种文化,
很多中国人不了解这一点,就会觉得美国的面试很难。

比如说,我们现在正在帮许多同学为国外的工作面试做准备,我们常常发现,大部分求职者从学历、学识和能力上都符合工作要求,但为什么还有很多人被刷下来呢?可能就是缺乏了所谓的X-factor。就像你找男女朋友一样,这个人什么都好,但你对他/她就是没感觉。
放到工作上也是一样,缺少一些X-factor,也容易让人家觉得:你人很好,但我就是不想和你一起工作。
这确实是一件看似不太公平又让人很无奈的事。我们常常安慰客户,很多时候真的不是你不够优秀或者面试中回答得不好,而是说,你没有那个X-factor, 显得不够有趣。

这个结论虽然让人伤心,但是好在,面试就是一场show, 一个不是很有趣的人也能在面试中假装自己很有趣。或者尽力呈现自己有趣的那一面。

那么,怎样才能在面试中成为一个有趣的人呢?

回答这个问题之前,我想先说一下,什么样的表现会让人觉得你不够有趣呢。
一是,非常严肃拘谨。
严肃认真是一种好品质,可是如果在面试中,语言和肢体行为都很紧张,给人感觉时刻绷着一根弦,就会让对方也很不自在,很难给面试官留下好印象。
二是,不会闲聊。
Small talk (闲聊)是外国人打交道的一种方式,类似我们的寒暄和搭话一样。很多同学不知道怎样去发起一次聊天,甚至对外国人的闲聊不知道怎么去回应,这就会容易犯尴尬症,让面试者觉得不够有趣。
三是,过度追求细节。
有些人讲一件事的时候,喜欢把来龙去脉讲得事无巨细。其实,当你沉浸于过多细节时,面试官可能早就倦怠了。而且,细枝末节讲得太多,也会让人觉得你拎不清楚重点,不会“讲故事”。
还有就是,不够灵活。面试是一个自我营销的过程,在这个过程中,你要学会很巧妙地适应别人。在面试之前,先研究好自己要应聘的职位需要哪些技能,再向别人展示你的相关优点,而不是一板一眼地说自己有多好。

以上就是中国学生在面试中常常踏入的“雷区”。那么,哪些行为会给你的“有趣值”加分呢?
首先就是我们刚才所说的,学会small talk。
开始一段闲聊有很多种不同的方式,比如,你可以说说你是怎么来这家公司的,路程是不是方便,也可以说这家公司的办公室给你什么第一印象。当然,还有一些更有针对性的话题,譬如你可以提前搜一下你的面试官是哪所学校毕业的,对什么运动感兴趣,是哪个球队的粉丝等等。
其次,大家也可以尝试一个游戏,叫imagination——想象自己是别人。
这个游戏听起来挺傻的,但我觉得很有用。我记得,《辛普森一家人》里面有一集讲的是辛普森很害怕公共演讲,他就想了一个办法,在台上想象自己是另外一个人,结果就超水平发挥了。我自己也有过这样的经历,这个想象中的“别人”不需要是Emma Watson那样遥不可及的公众人物,只要是身边那些让你感到钦佩和羡慕的人就可以。
还有一个办法,就是模仿。
不知道大家看不看TED show,TED里面很多人说话都极具感染力。如果你喜欢看TED的话,也可以从中找到一些灵感,学习并模仿他们的逻辑思维和说话方式。这就像我们跟着教练学健身一样,每一个动作的掌握都是通过模仿学到的。同理,要想在面试中成为一个有趣的人,也可以通过模仿一些有趣的人来达到。
除此之外,微笑也是一个神奇有效的办法。
即使在电话面试中,对方也可以感觉到你是在微笑着说话还是在面无表情地说话。所以,偶尔一边微笑一边说话,给人的感觉是很不一样的。我在面试中就经常发现,对面这个人笑起来感觉非常好,一下就会不自觉地给他/她加好几分。
成为一个有趣的人,还有一种能力很重要,就是storytelling——讲故事的能力。这里说的“讲故事”,并不是真的要你去有声有色地讲一个故事,而是如何与人分享你的经历,让别人感兴趣。
在面试中,一个成功的“故事”要突出你的困难和挑战,以及你是怎么克服它们的。最忌讳的就是平铺直叙地说,“我进了某某社团,做了什么职位,办了什么活动,一二三四五……”。我在面试中听到这样的阐述,不到两分钟就分心了。大家可能听说过一个叙述的原则叫STAR,即 Situation(情况)-Task(任务)-Action(行动)-Result(结果)。现在有一个更新的说法,叫SHARE,就是Situation(情况),Hindrance(障碍),Action(行动),Result(结果), Evaluation(评估)。SHARE和STAR最大的区别就在于,把原来的task变成了hindrance,也就是说在你的叙述中要更强调挑战和困难部分。我相信,这部分也是最能够抓住别人注意力的内容。
最后一点,就是成为一个知识丰富的人。我觉得,知识丰富是有趣的基础,如果一个人什么都不懂的话,很难想象他会是一个有趣的人。面试中,很多知识可以快速积累,比如一个公司的背景、行业信息等。花一两个小时了解清楚这些,就可以让你在面试中的对话更有水平。
不过,更多的功夫还是在平时,与其临时抱佛脚,不如平时就多多积累。我建议大家多看一些商业杂志,培养起business sense,这就跟大家平时通过看时尚杂志来培养fashion sense一样,只要多看多学,跟别人交流起来自然就会有趣而毫不费力。

Muscle-targeting AAV capsid through direct evolution

AAV-mediated gene-directed therapies hold great promise, but success is contingent on effective and safe transduction of the target tissue. This constitutes a particular challenge for the largest organ, skeletal muscle. In this issue of Cell, a study by Tabebordar et al. (2021) describes an ingenious method of directed capsid evolution generating a novel class of muscle-specific capsids that allow for lower and thus safer therapeutic doses. If successfully translated to human, this discovery along with the study by Weinmann et al. (2020) has the exciting potential to make muscle directed gene therapy safer, more effective, and more attainable.

Inherited disorders of skeletal muscle contribute significantly to genetic morbidity and mortality at all stages of life. Gene- and transcript-directed therapies are moving firmly toward the clinic, offering hope for a new therapeutic era of genetic medicines for these hitherto intractable disorders, with clinical trials of AAV-mediated gene therapy ongoing in individuals with Duchenne muscular dystrophy (DMD) (Duan, 2018), forms of limb-girdle muscular dystrophy, X-linked myotubular myopathy (XLMTM), and Pompe disease.

The systemic muscle-directed gene therapies currently use the natural AAV serotypes AAV8, AAV9, and AAVrh74. While they also target both skeletal and cardiac muscle, they are not selective and prominently target the liver. Skeletal muscle is unique in that it is the organ with the largest mass (about 40% of body mass) and an extremely wide anatomical distribution. To effectively target all relevant muscles for movement, breathing, and cardiac function, these serotypes currently used require very high systemic doses. With that, serious toxicities are now emerging in several of the muscle-directed clinical trials, resulting from the considerable and undesired targeting of the liver as well as from immunological issues, in particular complement system activation (Paulk, 2020). Such high doses also impose considerable strains on product manufacturing, resulting in scarcity and high costs.

In contrast, a capsid with specifically increased tropism to muscle while de-emphasizing the liver would allow for lower doses and decreased toxicities. Most of the tropism of AAV is dependent on cell receptor-binding epitopes of the AAV capsid, the functional landscape of which is increasingly understood (Wang et al., 2019). Along with rational in silico design of AAV capsids and new natural capsid discovery, innovative methods have been developed to empirically identify novel capsids with desired tropism based on evolutionary considerations, capsid shuffling, and directed evolution (Herrmann et al., 2019; Maheshri et al., 2006; Zinn et al., 2015) and others (Wang et al. [2019] for review). In the latter approach, new capsid libraries are generated by random peptide permutation within the hypervariable regions in the 3-fold protrusion of the capsid to modify tropism while preserving basic properties of AAV. This has led to promising developments such as the CREATE protocol, which was successfully applied for CNS targets (Deverman et al., 2016).

Two studies, by Weinmann et al. (Weinmann et al., 2020) and by Tabebordar et al. (Tabebordar et al., 2021), have been remarkably successful in achieving this for skeletal muscle. Weinmann et al. arrived at a highly myotropic capsid via a secondary in vivo screen of a preselected number of promising capsids using barcoded libraries to be screened at both the DNA and RNA levels. The ingenious approach taken by Tabebordar et al. involves screening the entire spectrum of randomly varied heptapeptide inserted in the hypervariable region VIII of AAV9, followed by an in vivo selection method, which, importantly, allows for screening of the entire randomly generated library in any strain or species. Using a muscle-specific promoter to drive the actual sequence of each AAV’s individual capsid as the “barcode,” specific targeting to muscle is selected for, requiring transduction, unpacking, and transcription in muscle. RNA sequencing of transcribed capsid sequences allows for recovery of muscle-enriched capsids out of the highly complex library. The authors refer to this method as DELIVER (directed evolution of AAV capsids leveraging in vivo expression of transgene RNA) (Figure 1).

Initially selected for in mice, this approach identified a capsid family that targeted muscle (and the heart) strikingly more efficiently as compared with the natural serotypes, with decreased targeting of the liver. This allowed for substantially lower systemic doses to achieve the desired therapeutic effect relative to the new capsids (referred to as MyoAAV): two traditional capsids in the myotubularin inactivation model (for XLMTM) delivering gene replacement and the mdx mouse model (for DMD) delivering gene editing. Remarkably, as earlier shown by Weinmann et al., the selected capsid family encoded an RGD integrin binding motif as their commonality. The muscle-targeting effect was at least partly dependent on integrin binding, offering a mechanistic window into the new tropism. It is encouraging for the muscle-targeting field and for rational capsid design that an RDG motif also emerged in the Weinmann study.

A caveat is how well these new tropisms will translate across species and strains (Hordeaux et al., 2019). Because of the easy species portability of the DELIVER protocol, it was possible to screen directly in a non-human primate (NHP), again arriving independently at a similar capsid with an RGD motif. This new NHP-derived iteration of MyoAAV appeared to be even better at muscle targeting, bringing potential translation to human within reach.

Preclinical rigor in the development of new capsids must be high, as the path to clinical translation remains arduous and expensive. Will it produce and package efficiently at the required clinical scale with preserved stability and potency? Would natural AAV9 seropositivity preclude dosing in human (AAV9 antibodies bind MyoAAV)? Evaluation of toxicity specifically in human is paramount, as the complement toxicity for instance was not predicted preclinically. Unpredicted toxicities from other organs and systems may also emerge. Still, the much lower systemic doses required (if translatable to human) will go a long way in mitigating any such systemic toxicities.

The feasibility and independent reproducibility of identifying bespoke capsids bodes well for gene-directed medicine, as its precision can be extended to the delivery tools. Given that all gene therapy is dependent on effective and safe delivery, the importance of this development is obvious.

REFERENCES
Deverman, B.E., Pravdo, P.L., Simpson, B.P., Kumar, S.R., Chan, K.Y., Banerjee, A., Wu, W.L.,
Yang, B., Huber, N., Pasca, S.P., and Gradinaru, V. (2016). Cre-dependent selection yields AAV variants for widespread gene transfer to the adult brain. Nat. Biotechnol. 34, 204–209.
Duan, D. (2018). Systemic AAV Micro-dystrophin Gene Therapy for Duchenne Muscular Dystrophy.Mol. Ther. 26, 2337–2356.
Herrmann, A.K., Bender, C., Kienle, E., Grosse,S., El Andari, J., Botta, J., Schu¨rmann, N.,
Wiedtke, E., Niopek, D., and Grimm, D. (2019).A Robust and All-Inclusive Pipeline for Shuffling
of Adeno-Associated Viruses. ACS Synth. Biol.8, 194–206.
Hordeaux, J., Yuan, Y., Clark, P.M., Wang, Q., Martino, R.A., Sims, J.J., Bell, P., Raymond, A., Stanford, W.L., and Wilson, J.M. (2019). The GPI-LinkedProtein LY6A Drives AAV-PHP.B Transport acrossthe Blood-Brain Barrier. Mol. Ther. 27, 912–921
Maheshri et al., 2006
N. Maheshri, J.T. Koerber, B.K. Kaspar, D.V. Schaffer Directed evolution of adeno-associated virus yields enhanced gene delivery vectors Nat. Biotechnol., 24 (2006), pp. 198-204
N. Paulk Gene Therapy: It’s Time to Talk about High-Dose AAV. Genetic Engineering & Biotechnology News (2020) https://www.genengnews.com/commentary/gene-therapy-its-time-to-talk-about-high-dose-aav/
S. Pipe, F.W.G. Leebeek, V. Ferreira, E.K. Sawyer, J. Pasi Clinical Considerations for Capsid Choice in the Development of Liver-Targeted AAV-Based Gene TransferMol. Ther. Methods Clin. Dev., 15 (2019), pp. 170-178
M. Tabebordar, K.A. Lagerborg, A. Stanton, E.M. King, S. Ye, L. Tellez, A. Krunnfusz, S. Tavakoli, J.J. Widrick, K.A. Messemer, et al. Directed evolution of a family of AAV capsid variants enabling potent muscle-directed gene delivery across speciesCell, 184 (2021), pp. 4919-4938
D. Wang, P.W.L. Tai, G. Gao Adeno-associated virus vector as a platform for gene therapy deliveryNat. Rev. Drug Discov., 18 (2019), pp. 358-378
J. Weinmann, S. Weis, J. Sippel, W. Tulalamba, A. Remes, J. El Andari, A.K. Herrmann, Q.H. Pham, C. Borowski, S. Hille, et al.Identification of a myotropic AAV by massively parallel in vivo evaluation of barcoded capsid variantsNat. Commun., 11 (2020), p. 5432
E. Zinn, S. Pacouret, V. Khaychuk, H.T. Turunen, L.S. Carvalho, E. Andres-Mateos, S. Shah, R. Shelke, A.C. Maurer, E. Plovie, et al. In Silico Reconstruction of the Viral Evolutionary Lineage Yields a Potent Gene Therapy VectorCell Rep., 12 (2015), pp. 1056-1068

Antisense Oligonucleotides

Source: https://www.sigmaaldrich.com/US/en/technical-documents/technical-article/genomics/gene-expression-and-silencing/antisense-oligonucleotides

This article summarizes several of the common mechanisms of antisense gene modulation and more importantly, considerations to take into account when designing an antisense oligonucleotide (ASO). After decades of research, there are no hard and fast design rules; it is still trial and error. However, there are guidelines to be followed that should make the process more manageable.
Modulation Mechanisms

Traditional ASO-based gene modulation (usually synonymous with silencing or downregulation of gene expression, but it can be used to improve gene expression and, in at least one particular case, it was shown to lead to upregulation of gene expression) targets mRNA and can take place in either the nucleus or the cytoplasm. In the nucleus (pre-mRNA is the target), modulation typically works by redirecting polyadenylation, altering splicing events, or cleaving internucleotide bonds, all of which occur during mRNA maturation (Figure 1). In the cytoplasm (mature mRNA is the target), modulation typically works either by translational alteration without cleavage or cleavage, both of which occur just prior to / during translation (Figure 2).
ASO-based gene modulation mechanisms in the nucleus

Figure 1. ASO-based gene modulation mechanisms in the nucleus. In the case of mammals, gDNA in the nucleus is transcribed to pre-mRNA. An exogenous ASO in the nucleus hybridizes A) to the 3′-most polyadenylation signal on the pre-mRNA and blocks polyadenylation at this site, thereby redirecting it to another site upstream, which upregulates gene expression1 B) to a splice site, thereby preventing proper assembly of the spliceosome, which leads to exon skipping and therefore improved expression of a disease gene2 (not considered a true ASO by many, these are often called splice switching oligonucleotides [SSO] or more generally, steric blocking oligonucleotides [SBO]) C) an exon or intron (in this case, an intron), thereby leading to cleavage by RNase H3. In most cases, though significantly upregulated, silenced, or altered, some processing of the unaffected pre-mRNA is likely to occur followed by export of the mature mRNA to the cytoplasm. S = polyadenylation signal sequence (though only one is shown here, there can be more than one per transcript).
ASO-based gene modulation mechanisms in the cytoplasm

Figure 2. ASO-based gene modulation mechanisms in the cytoplasm.In the case of mammals, gDNA in the nucleus is 1) transcribed to pre-mRNA 2) pre-mRNA is processed (5′ cap and 3′ poly[A] tail are added) and spliced (introns are removed) to produce mature mRNA and 3) mature mRNA is exported to the cytoplasm. An exogenous ASO hybridizes to the mature mRNA in the cytoplasm and silences (downregulates) gene expression by A) translation alteration, in this case translation inhibition by disrupting ribosomal assembly at the 5′ cap4 (often not considered a true ASO, this is an example of a general SBO) or B) cleavage by RNase H (specifically, RNase H1 in humans)3. In most cases, though significantly downregulated, translation still occurs.

ASOs recognize and hybridize to target mRNAs by Watson-Crick base pairing. ASOs that lead to cleavage of target mRNAs by RNase H (whether in the nucleus or cytoplasm3) are widely studied for research and therapeutic purposes and therefore are the best understood in terms of modulation mechanism. Using magnesium ions as a cofactor, RNase H (specifically, RNase H1 in humans) cleaves the mRNA strand in the mRNA:DNA heteroduplex via hydrolysis of the internucleotide (phosphodiester) bond5. Following cleavage, the ASO remains intact while the former scissile bond is now free 3′-hydroxyl and 5′-phosphate groups on the 5′ and 3′ fragments, respectively, of the degraded mRNA.
Design Considerations

In principle, gene silencing should be as simple as selecting a sequence within a target mRNA; ordering the complementary, Watson-Crick-base-pairing ASO from a vendor; introducing it into the system under study (either in vitro or in vivo); and, observing the expected effect by the relevant reporter. However, there are many considerations to take into account for successful ASO design.
Hybridization Site

Following the rules of Watson-Crick base pairing, an ASO should hybridize to any region of a target mRNA sequence. However, mRNAs fold into secondary and even tertiary structures, which likely block ASO hybridization. Therefore, non-folded regions of mRNAs should be selected as the hybridization sites. There are wet-laboratory methods, such RNase H mapping that are useful in predicting an accessible site, but a good place to start is to try a predictive RNA folding algorithm, e.g. mfold.

Once a non-folded region has been identified, a secondary consideration should be if the region serves as a binding site for spliceosomes, ribosomes, proteins, or other macromolecular assemblies. Historically, the 5′ cap, initiation codon, 3′ untranslated region / polyA tail have been good site selections. Even if the ASO fails to activate RNase H, it may still lead to silencing since it will sterically block the machinery needed for mRNA maturation or translation.
Nuclease Degradation

In vivo and in vitro, all-native DNA ASOs are quickly rendered useless by nuclease activity. In vivo, though both endonucleases and exonucleases may lead to degradation, exonucleases appear to do most of the damage. To be effective, all ASOs require chemical modification to resist nuclease degradation. Though numerous nucleic acid analogs are available for modifying ASOs, herein only those that are part of our standard modifications offering will be explored (Table 1).

Three regions of ASOs are subject to modification (internucleotide linkages, sugars, and bases), and in all subsequent sections, modifications are classified according to their primary effect, even though several have more than one effect, e.g. modification X primary effect: improves binding affinity; secondary effect: reduces the deleterious impact from immunostimulation (the focus of this article will remain on the primary effect).
Modification by Type
Internucleotide Linkages
Chemistry Abbreviation Structure
Phosphorothioate (aka Thiophosphate or S-oligo) PS (* in sequence constructs)

Sugars
Chemistry Abbreviation Structure
Methyl RNA 2′-OMe-RNA ([mA], [mC], [mG], & [mU] in sequence constructs)

mA
Table 1Available modifications that are primarily intended to resist nuclease degradation.

Phosphorothioate. This modification was among the few that is considered first-generation. PS-ASOs are nuclease resistant and, therefore, have longer plasma half lives compared to all-native DNA ASOs. In addition, they retain negative backbone charges, which facilitates PS-ASO entry into the cell. Interestingly, PS appears to have a bigger impact on transport and entry into the cell than it does on nuclease resistance.

However, PS-ASOs are not completely protected from nucleases, have reduced hybridization to target mRNAs (see the Binding Affinity section), and must be continually administered in large quantities to maintain modulation. In addition, PS can interact with proteins in vivo and therefore lead to negative side effects, including immune system activity.

Methyl RNA. This modification was among the few that are considered second-generation. When combined with PS in ASOs, 2′-OMe-RNA has been found to improve upon the benefits of PS alone (i.e. increased nuclease resistance, plasma half life, and tissue uptake).
Immunostimulation

Bacterial DNA contains a much higher frequency of CpG (cytosine-phosphodiester bond-guanine) dinucleotides lacking methylation than does vertebrate DNA. This is primarily because CpG dinucleotides are underrepresented in the vertebrate genome and 80% of them are labeled with methyl groups. Since the CpG motif in bacteria triggers activation of B cells, NK cells, monocytes, and cytokines whereas the vertebrate CpG motif does not, this is likely at least one of the ways that the immune system recognizes a bacterial infection. ASOs containing unmethylated CpG (CpsG: cytosine-phosphorothioate bond-guanine is even more potent) motifs stimulate the immune system in a manner similar to that of bacterial DNA and may have been responsible for some reported effects from early antisense studies.

To avoid immunostimulation, design ASOs lacking CpG / CpsG motifs, if possible, or least those lacking the following extended motif, which produces the strongest immune response:

purine-purine-CpG-pyrimidine-pyridmidine

Given that this may be difficult to avoid due to the complementary nature of the target site selection sequence, the next best step is to replace the cytosine in CpG / CpsG with 5’-methylcytosine (Table 2), which has been shown to decrease immunostimulation significantly.
Modification by Type

Bases
Chemistry Abbreviation Structure
5-methylcytosine 5-Me-dC ([5MedC] in sequence constructs)

Table 2Available modification that is primarily intended to prevent immunostimulation.
Sequence Length

Optimum lengths are usually from 12 to 28 bases. Sequences shorter than 12 bases increase the probability of off-target hybridization, while sequences longer than 25 bases increase the chance of reduced cellular uptake.
Self Complementarity

The ASO should be checked for secondary structure and oligonucleotide dimer formation as either one might interfere with hybridization to the target site sequence. If possible, design the ASO to have the weakest secondary structure possible as well as no dimer formation. Our oligonucleotide sequence calculator OligoEvaluator™ allows for quick determination of these self-forming structures.
G-Quartet Structures

ASOs containing stretches of two or more C or G nucleotides are able to form unusual structures, which may produce undesirable, off-target effects. The most common and studied are stretches of G bases, which can lead to the formation of G-quartets. These quartets have been shown to bind to proteins, including transcription factors, which may mimic and therefore interfere with antisense activity.

To avoid formation of these quartets, design ASOs lacking these polyG stretches, if possible. Again, given that this may not be feasible, the next best step is to replace the guanine with 7-deaza-dG (Table 3), which will block quartet formation.
Modification by Type

Bases
Chemistry Abbreviation Structure
7-deaza-dG [Deaza-dG] in sequence constructs (not available for online ordering, so please inquire)

Table 3Available modification that is primarily intended to prevent G-quartet formation.
Functional Motifs

A statistical analysis of PS-ASO experiments found that the following motifs:

CCAC
TCCC
ACTC
GCCA
CTCT

correlate with enhanced antisense efficiency, whereas these motifs:

GGGG
ACTG
AAA
TAA

diminish antisense activity. It has been found that RNase H activity is sequence independent; Therefore, it is believed that the enhancing motifs lead to increased thermodynamic stability of the mRNA:ASO heteroduplex through the preponderance of GC Watson-Crick base pairing.
Binding Affinity

As already discussed, it is critically important to identify a site within the target mRNA that is free of folds as well as to ensure that the ASO also has no deleterious self complementarity. However, these considerations alone are not enough to ensure proper hybridization. Various factors, such as PS can reduce ASO binding affinity for the target site, which in turn minimizes antisense effectiveness.

Third-generation ASO modifications have been found not only to be nuclease resistant but also to improve binding affinity. Locked Nucleic Acid® (Table 4), with its constrained ring structure, is particularly useful for improving ASO binding affinity and effectiveness (melting temperature change per monomer addition varies from +3 to +11 °C compared to native DNA only).
Modification by Type

Bases
Chemistry

Abbreviation


Structure

Locked Nucleic Acid

LNA®

([+A], [+C], [+G], & [+T] in sequence constructs; not currently available for online ordering, so please inquire)

Table 4Available modification that is primarily intended to improve ASO binding affinity.
The Construct

To give insight into ASO sequences, examples of several antisense drugs (often the primary purpose of pursuing antisense research) that have been approved or are in clinical trials are provided here. These drugs are examples of (or are expected to be in the case of those in clinical trials) all of the desired outcomes when it comes to antisense: good design, an available delivery mechanism, and effective modulation. The same outcomes are critical to the success of research experiments (our ASOs are for in vitro and in vivo animal RUO [Research Use Only]).

First generation. In 1998, Fomivirsen (brand name Vitravene) was the first approved antisense drug. It was used to treat cytomegalovirus retinitis (CMV) in immunocompromised patients, including those with AIDS. The drug was delivered by intravitreal injection. The 21mer ASO with all PS internucleotide linkages has the following sequence:

G*C*G*T*T*T*G*C*T*C*T*T*C*T*T*C*T*T*G*C*G

○ * = PS

and works by inhibiting translation of transcribed mRNA from the CMV gene UL123. It was eventually withdrawn from the market because the development of HAART (highly active antiretroviral therapy) to treat HIV reduced the number of CMV cases by 75% and therefore led to poor sales.

Since PS-only ASOs are not completely protected from nucleases, have reduced hybridization to target mRNAs, must be continually administered in large quantities to maintain modulation, and can interact with proteins, which may lead to negative side effects, first-generation constructs have largely been abandoned in R&D pipelines.

Second generation. In 2013, Mipomersen (brand name Kynamro®) became the second approved antisense drug. It is used to treat familial hypercholesterolemia, a hereditary disorder. The drug is delivered by subcutaneous injection. The 20mer ASO with all PS internucleotide linkages has the following sequence:

G*mC*mC*mU*mC*A*G*T*mC*T*G*mC*T*T*mC*G*mC*A*mC*mC

○ Underline = 2′-O-MOE-RNA (MOE is 2-methoxyethyl)

○ m = methyl, i.e. 5-Me-dC & 5-Me-U

○ * = PS

and works by inhibiting translation of apolipoprotein B-100 mRNA23. There is a risk of severe liver damage, so the drug has to be part of a risk management plan.

Second-generation antisense molecules, such as Mipomersen, are designed with the 5-10-5 gapmer configuration. This can be seen in the sequence above: 5′ and 3′ wings of 5 bases (modified with a nuclease-resistant / enhanced-binding-affinity sugar modification) and a central gap of 10 standard deoxyribonucleotides (no sugar modification) that allows for RNase H binding.

In this particular case, the wings consist of 2′-O-MOE-RNA (MOE is 2-methoxyethyl), a non-standard sugar modification. However, we might be able to add this to your construct, so please send a request to dnaoligos@sial.com for feasibility.

Third generation. As of 2017, Miravirsen (SPC3649) is in Phase II clinical trials. It is being tested as a treatment for hepatitis C (HCV). The drug is delivered by subcutaneous injection. The 15mer ASO with all PS internucleotide linkages has the following sequence:

C*C*A*T*T*G*T*C*A*C*A*C*T*C*C

○ Underline = LNA

○ * = PS

and works by hybridizing to human miRNA, miR-122. This prevents miR-122 from bringing argonaute to the 5′-UTR region of the HCV RNA, where it normally binds and therefore protects against nuclease degradation. Therefore, Miravirsen allows for destruction of the viral RNA.

Though Miravirsen is not a traditional ASO as it targets miRNA and therefore only indirectly leads to degradation of mRNA, it is one of the best examples of a third-generation construct containing LNA, hence it is included here.

Target Check

The final non-modified ASO sequence should be put through a BLAST search to ensure that any off-target hybridization — preferrably none — will not interfere with antisense activity or lead to unacceptable toxicity.
Quality Considerations

For in vivo animal experiments, we recommend ASOs undergo in-vivo-grade purification with a salt exchange (replaces toxic ammonium ions from the phosphoramidite synthesis chemistry with physiological sodium ions), endotoxin testing (ensures that pyrogens are present below an acceptable ceiling), and filtration (reduces the number of contaminating CFU below an acceptable ceiling). Our iScale Oligos™ product is larger quantities of material for in vivo projects that can be ordered with this purification and all of these additional services.
Delivery & Toxicity

Though beyond the scope of this article, there are several excellent review papers that discuss various delivery mechanisms as well as potential toxicities.
Conclusion

When you have designed an ASO that you want to try in an experiment, we are ready to synthesize it for you (our ASOs are for in vitro and in vivo animal RUO [Research Use Only]). If additional help is needed, especially regarding the feasibility of manufacturing ASOs with non-standard modifications, please send a request to dnaoligos@sial.com.
References
1.
Vickers TA. 2001. Fully modified 2′ MOE oligonucleotides redirect polyadenylation. 29(6):1293-1299. http://dx.doi.org/10.1093/nar/29.6.1293
2.
Kole R, Krainer AR, Altman S. 2012. RNA therapeutics: beyond RNA interference and antisense oligonucleotides. Nat Rev Drug Discov. 11(2):125-140. http://dx.doi.org/10.1038/nrd3625
3.
Liang X, Sun H, Nichols JG, Crooke ST. 2017. RNase H1-Dependent Antisense Oligonucleotides Are Robustly Active in Directing RNA Cleavage in Both the Cytoplasm and the Nucleus. Molecular Therapy. 25(9):2075-2092. http://dx.doi.org/10.1016/j.ymthe.2017.06.002
4.
Baker BF, Lot SS, Condon TP, Cheng-Flournoy S, Lesnik EA, Sasmor HM, Bennett CF. 1997. 2?-O-(2-Methoxy)ethyl-modified Anti-intercellular Adhesion Molecule 1 (ICAM-1) Oligonucleotides Selectively Increase the ICAM-1 mRNA Level and Inhibit Formation of the ICAM-1 Translation Initiation Complex in Human Umbilical Vein Endothelial Cells. J. Biol. Chem.. 272(18):11994-12000. http://dx.doi.org/10.1074/jbc.272.18.11994
5.
Deleavey G, Damha M. 2012. Designing Chemically Modified Oligonucleotides for Targeted Gene Silencing. Chemistry & Biology. 19(8):937-954. http://dx.doi.org/10.1016/j.chembiol.2012.07.011
6.
Patil SD, Rhodes DG, Burgess DJ. 2005. DNA-based therapeutics and DNA delivery systems: A comprehensive review. AAPS J. 7(1):E61-E77. http://dx.doi.org/10.1208/aapsj070109
7.
Goodchild J, Carroll E, Greenberg JR. 1988. Inhibition of rabbit ?-Globin synthesis by complementary oligonucleotides: Identification of mRNA sites sensitive to inhibition. Archives of Biochemistry and Biophysics. 263(2):401-409. http://dx.doi.org/10.1016/0003-9861(88)90652-2
8.
Fisher TL, Terhorst T, Cao X, Wagner RW. 1993. Intracellular disposition and metabolism of fluorescently-labled unmodified and modified oligouncleotides microijjected into mammalian cells. Nucl Acids Res. 21(16):3857-3865. http://dx.doi.org/10.1093/nar/21.16.3857
9.
EDER PS, DeVINE RJ, DAGLE JM, WALDER JA. 1991. Substrate Specificity and Kinetics of Degradation of Antisense Oligonucleotides by a 3? Exonuclease in Plasma. Antisense Research and Development. 1(2):141-151. http://dx.doi.org/10.1089/ard.1991.1.141
10.
DAGLE JM, WEEKS DL, WALDER JA. 1991. Pathways of Degradation and Mechanism of Action of Antisense Oligonucleotides inXenopus laevisEmbryos. Antisense Research and Development. 1(1):11-20. http://dx.doi.org/10.1089/ard.1991.1.11
11.
Mansoor M, Melendez AJ. 2008. Advances in Antisense Oligonucleotide Development for Target Identification, Validation, and as Novel Therapeutics. Gene?Regul Syst Bio. 2GRSB.S418. http://dx.doi.org/10.4137/grsb.s418
12.
Khvorova A, Watts JK. 2017. The chemical evolution of oligonucleotide therapies of clinical utility. Nat Biotechnol. 35(3):238-248. http://dx.doi.org/10.1038/nbt.3765
13.
Weiner GJ, Liu H, Wooldridge JE, Dahle CE, Krieg AM. 1997. Immunostimulatory oligodeoxynucleotides containing the CpG motif are effective as immune adjuvants in tumor antigen immunization. Proceedings of the National Academy of Sciences. 94(20):10833-10837. http://dx.doi.org/10.1073/pnas.94.20.10833
14.
KRIEG AM, MATSON S, FISHER E. 1996. Oligodeoxynucleotide Modifications Determine the Magnitude of B Cell Stimulation by CpG Motifs. Antisense and Nucleic Acid Drug Development. 6(2):133-139. http://dx.doi.org/10.1089/oli.1.1996.6.133
15.
Henry S, Stecker K, Brooks D, Monteith D, Conklin B, Bennett C. 2000. Chemically modified oligonucleotides exhibit decreased immune stimulation in mice.. J Pharmacol Exp Ther. 292468-79. https://pubmed.ncbi.nlm.nih.gov/10640282/
16.
Williamson JR, Raghuraman M, Cech TR. 1989. Monovalent cation-induced structure of telomeric DNA: The G-quartet model. Cell. 59(5):871-880. http://dx.doi.org/10.1016/0092-8674(89)90610-7
17.
Tam R, Lin C, Lim C, Pai B, Stoisavljevic V. 1999. Inhibition of CD28 expression by oligonucleotide decoys to the regulatory element in exon 1 of the CD28 gene.. J Immunol. 1634292-9. https://pubmed.ncbi.nlm.nih.gov/10510368/
18.
Murchie A, Lilley D. 1994. Tetraplex folding of telomere sequences and the inclusion of adenine bases.. The EMBO Journal. 13(4):993-1001. http://dx.doi.org/10.1002/j.1460-2075.1994.tb06344.x
19.
Matveeva OV. 2000. Identification of sequence motifs in oligonucleotides whose presence is correlated with antisense activity. 28(15):2862-2865. http://dx.doi.org/10.1093/nar/28.15.2862
20.
Ho S. 1996. Potent antisense oligonucleotides to the human multidrug resistance-1 mRNA are rationally selected by mapping RNA-accessible sites with oligonucleotide libraries. 24(10):1901-1907. http://dx.doi.org/10.1093/nar/24.10.1901
21.
Wahlestedt C, Salmi P, Good L, Kela J, Johnsson T, Hokfelt T, Broberger C, Porreca F, Lai J, Ren K, et al. 2000. Potent and nontoxic antisense oligonucleotides containing locked nucleic acids. Proceedings of the National Academy of Sciences. 97(10):5633-5638. http://dx.doi.org/10.1073/pnas.97.10.5633
22.
Mulamba GB, Hu A, Azad RF, Anderson KP, Coen DM. 1998. Human Cytomegalovirus Mutant with Sequence-Dependent Resistance to the Phosphorothioate Oligonucleotide Fomivirsen (ISIS 2922). Antimicrob. Agents Chemother.. 42(4):971-973. http://dx.doi.org/10.1128/aac.42.4.971
23.
Geary RS, Baker BF, Crooke ST. 2015. Clinical and Preclinical Pharmacokinetics and Pharmacodynamics of Mipomersen (Kynamro®): A Second-Generation Antisense Oligonucleotide Inhibitor of Apolipoprotein B. Clin Pharmacokinet. 54(2):133-146. http://dx.doi.org/10.1007/s40262-014-0224-4
24.
Liang X, Sun H, Nichols JG, Crooke ST. 2017. RNase H1-Dependent Antisense Oligonucleotides Are Robustly Active in Directing RNA Cleavage in Both the Cytoplasm and the Nucleus. Molecular Therapy. 25(9):2075-2092. http://dx.doi.org/10.1016/j.ymthe.2017.06.002
25.
Titze-de-Almeida R, David C, Titze-de-Almeida SS. 2017. The Race of 10 Synthetic RNAi-Based Drugs to the Pharmaceutical Market. Pharm Res. 34(7):1339-1363. http://dx.doi.org/10.1007/s11095-017-2134-2
26.
Gebert LFR, Rebhan MAE, Crivelli SEM, Denzler R, Stoffel M, Hall J. 2014. Miravirsen (SPC3649) can inhibit the biogenesis of miR-122. 42(1):609-621. http://dx.doi.org/10.1093/nar/gkt852
27.
Chan JH, Lim S, Wong WF. 2006. ANTISENSE OLIGONUCLEOTIDES: FROM DESIGN TO THERAPEUTIC APPLICATION. Clin Exp Pharmacol Physiol. 33(5-6):533-540. http://dx.doi.org/10.1111/j.1440-1681.2006.04403.x
28.
Godfrey C, Desviat LR, Smedsrød B, Piétri?Rouxel F, Denti MA, Disterer P, Lorain S, Nogales?Gadea G, Sardone V, Anwar R, et al. 2017. Delivery is key: lessons learnt from developing splice?switching antisense therapies. EMBO Mol Med. 9(5):545-557. http://dx.doi.org/10.15252/emmm.201607199
29.
Sun Y, Zhao Y, Zhao X, Lee RJ, Teng L, Zhou C. Enhancing the Therapeutic Delivery of Oligonucleotides by Chemical Modification and Nanoparticle Encapsulation. Molecules. 22(10):1724. http://dx.doi.org/10.3390/molecules22101724
30.
Krhac Levacic A, Morys S, Wagner E. 2017. Solid-phase supported design of carriers for therapeutic nucleic acid delivery. 37(5): http://dx.doi.org/10.1042/bsr20160617

Library Preparation for Next-Generation Sequencing:Dealing with PCR Bias

From mapping the entire human genome to personalizing treatments based on specific mutations in an individual’s genome, we have come a long way! Next-generation sequencing (NGS), almost single- handedly, has enabled this gigantic leap in progress. Transforming the tedious chain termination method to a more automated and high-throughput sequencing by synthesis technique, NGS revolutionized the understanding of genetic variations and their implications. Apart from sequencing of fragments of DNA (DNA-Seq), sequencing of whole genomes (whole genome sequencing), exomes or transcriptomes (whole transcriptome sequencing), epigenomes (Methyl-Seq and ChIP-Seq) or even single cells (single cell sequencing) is now possible at a reasonable cost. While all these approaches have yielded valuable information, they suffer from an inherent problem of incomplete or misrepresentation of data, which consequently leads to misinterpretation of information. The predominant factor leading to misrepresentation of data is the bias prevalent in almost all steps of NGS sample preparation. In this article, we focus on PCR bias in NGS library preparation and highlight a few publications where solutions to this bias have been documented.

Bias during amplification of AT- and GC-rich regions

During NGS library preparation, DNA or RNA molecules are fragmented, ligated to adapters suitable for the particular sequencer used, size selected and amplified using PCR. Most of the enzymatic steps within library construction protocols introduce bias in sample composition. One of the most likely sources of bias is the PCR amplification step, which could yield uneven base composition due to the fact that amplification is not uniform among fragments. Samples with high GC or AT content are not amplified as efficiently, and when this inefficiency is amplified exponentially over several cycles in PCR, it leads to notable inaccuracies in sequencing results. To avoid this, special caution is needed in selecting DNA polymerases used for the amplification step. A comparative study published in Nature Methods assessing biases in PCR amplification during NGS library preparation1 assessed the efficiency of several DNA polymerases under different reaction conditions to amplify adapter-ligated fragments for Illumina sequencing. They tested several microbial genomes with differing GC content (from approximately 20% to 70%) for depth of coverage under different experimental conditions, such as standard amplification, with a qPCR formulation or with annealing and extension at 60oC. Their results stated that KAPA HiFi DNA polymerase was the optimal enzyme for NGS library amplification. Genomic coverage was also reported to be highly uniform using the KAPA HiFI DNA polymerase enzyme, and was very close to results obtained without PCR for all tested GC contents.1

Efficient amplification of AT-rich regions require low annealing temperatures, but this often results in misannealing and nonspecific amplification.2 Tetramethyleneammonium chloride (TMAC), a DNA-binding reagent, is often added in PCR reactions of samples with high AT content for increasing the melting temperature, and consequently, the thermostability of AT pairs. However, TMAC by itself could inhibit the polymerase activity of some enzymes. A study that explored optimal library preparation procedures for samples with high AT content tested several enzymes (Phusion, AccuPrime Taq HiFi, Platinum pfx, KAPA HiFi and KAPA2G) and found that among all of them, only KAPA HiFi and KAPA2G Robust were able to amplify the AT-rich locus efficiently in the presence of the TMAC additive.3 This study also confirmed that KAPA HiFi DNA polymerase amplified the AT-rich Plasmodium falciparum genome more uniformly and provided the best coverage compared to all the other enzymes and that its amplification and coverage depth were closer to that of PCR-free conditions.

PCR-free amplification could yield better read distribution and coverage compared to PCR methods, but would require large quantities of starting DNA material. Therefore, this method is not highly practical to use, especially when sample volume is limiting (such as in FFPE samples).

PCR bias during library preparation for RNA-Seq

RNA-Seq also faces several challenges during library preparation, such as removal of highly abundant ribosomal RNA and PCR bias during amplification of the adapter-ligated library. A publication that reviewed reported biases in DNA and RNA library preparation4 found that KAPA HiFi DNA polymerase performed better than most enzymes and suggests that KAPA HiFi is a better choice than traditional polymerases for the amplification step. Since the RNA-Seq workflow includes more steps to convert RNA to cDNA prior to library construction, reducing PCR bias could help alleviate bias introduced in the process.

Dealing with bias

Given the extreme complexity of the NGS library construction and sequencing process, bias is something that cannot be entirely eliminated. The best way to mitigate bias is to recognize where the possible sources are introduced and use the most optimal library construction reagents. There are some comparative studies and reviews with extensive analysis of the sources of bias in each step of library preparation.1,4 These studies have evaluated the performance of library preparation reagents under different conditions and have made recommendations. Therefore, instead of reinventing the wheel, you may be able to utilize the optimized protocols and reagents directly and fine-tune them for your specific applications. Some studies have focused on specific biases (for example coverage of genomes with extreme AT-rich regions) and have developed optimized protocols for them.3 Using these pre-optimized protocols and reagents documented and recommended in published work could save time, cost and effort.

References

Quail MA, Otto TD, Gu T et al. Optimal enzymes for amplifying sequencing libraries. Nat.Methods. (2012);9:10–11.
Chevet E, Lemaitre G and Katinka MD. Low concentrations of tetramethylammonium choloride increase yield and specificity of PCR. Nucleic Acids Res. 1995;23;16:3343-3344.
Oyola SO, Otto TD, Gu Y et al. Optimizing Illumina next-generation sequencing library preparation for extremely AT-biased genomes. BMC Genomics 2012;13:1
van Dijk EL, Jaszczyszyn Y, Thermes C. Library preparation methods for next-generation sequencing: Tone down the bias. Experimental Cell Res. 2014;322:12-20.

核酸提取试剂盒的原理

A Step-by-Step Guide to Nucleic Acid Extraction Kits
Step 1: Cell Lysis

Lysis formulas may vary depending on whether you want to extract DNA or RNA. Generally speaking, lysis buffers contain a high concentration of chaotropic salts. Chaotropes have two important roles in nucleic acid extraction:

They destabilize hydrogen bonds, van der Waals forces, and hydrophobic interactions, leading to destabilization of proteins, including nucleases;
They disrupt the association of nucleic acids with water, thereby providing optimal conditions for their transfer to silica.

Chaotropic salts include guanidine HCL, guanidine thiocyanate, urea, and lithium perchlorate.

In addition to chaotropes, a detergent is often present in the lysis buffer to aid protein solubilization and cell lysis.

Enzymes may also feature here, depending on the sample type. The broad-spectrum serine protease Proteinase K is very efficient in digesting proteins away from nucleic acid preparations. Proteinase K works best under protein denaturing conditions (i.e. in denaturing lysis buffer). Another popular enzyme here, lysozyme, does not work under denaturing conditions and will be most active before the addition of denaturing salts.

Bear in mind that lysis for plasmid isolation is very different from lysis for RNA or genomic DNA extraction because plasmids must be separated from genomic DNA first. The addition of chaotropes will release all types of DNA at once, losing the ability to differentiate small circular DNA from high molecular weight chromosomes. Therefore, in plasmid preps, the chaotropes are not added until after cell lysis. For additional reading, check out these great articles on alkaline lysis and plasmid and genomic DNA extraction.


Step 2: Purification – Binding Nucleic Acids to the Column

As discussed above, chaotropic salts are critical for lysis and binding to the column. The addition of ethanol (or sometimes isopropanol) will further enhance and influence the binding of nucleic acids to the silica.

Note that the percentage and volume of ethanol used are important. Too much ethanol will bring down degraded material and small species that will influence absorbance at 260 nm (A260 readings). On the other hand, too little ethanol may impede the washing of the salt from the membrane.

Fortunately, the amount of ethanol added will be optimal for the nucleic acid extraction kit you are using. However, if you suspect that degraded DNA is inflating your A260 readings, you can consider re-optimizing the ethanol concentration.

Another useful tip is to save the flow-through and precipitate it to see if you can find your lost material. If you used an SDS-containing detergent for lysis, try using NaCl as a precipitant to avoid detergent contamination of your nucleic acids.


Step 3: Washing

After centrifuging your lysate through the silica membrane the desired nucleic acids should be bound to the column and impurities such as protein and polysaccharides should be in the flow-through. However, the membrane will contain protein and salt residues. At this point, plant samples will likely contain polysaccharides and pigments, while for blood samples, the membrane may be slightly brown or yellow in color. The wash steps remove such impurities.

There are typically two wash steps, although this varies depending on sample type. The first wash will often include a low concentration of chaotropic salts to remove residual proteins and pigments. This is always followed by an ethanol wash to remove the salts. If the sample didn’t contain a lot of protein starting out (e.g., plasmid preps or PCR clean-ups), an ethanol wash is sufficient.

Removal of the chaotropic salts is crucial to getting high yields and purity. Some kits actually recommend two ethanol washes. Residual salt will impede the elution of nucleic acid, resulting in poor yield, high A230 readings, and thus low A260/230 ratios.


Step 4: Dry Spin for Ethanol-free DNA and RNA

Most protocols include a centrifugation step after washing to dry the column of residual ethanol, and this step is essential for a clean eluent. Subsequent addition of 10 mM Tris buffer or water to the membrane will hydrate the nucleic acids, thus eluting them from the membrane. Residual ethanol on the membrane at this point will prevent full hydration and elution of nucleic acids.

You will not be able to see ethanol on a spectrophotometer, but a good indicator of its presence is samples that will not sink into the wells of an agarose gel, even in the presence of loading dye. Another indicator of ethanol contamination is samples that don’t freeze at -20°C.


Step 5: The Final Frontier – Elution

The final step in the DNA extraction protocol is the release of pure DNA or RNA from the silica.

For DNA extraction, 10 mM Tris at pH 8-9 is typically used. DNA is more stable at a slightly basic pH and will dissolve faster in a buffer than water. This is true even for DNA pellets. Water tends to have a lower pH of 4-5, and high molecular weight DNA may not completely rehydrate in the short time used for elution. For maximal DNA elution, allow the buffer to stand in the membrane for a few minutes before centrifugation. For applications requiring intact high molecular weight DNA, such as long-range sequencing and long-read sequencing, elution buffer is the best choice.

RNA, however, can tolerate a slightly acidic pH and dissolves readily in water, making this the preferred diluent.


What Can Go Wrong with Nucleic Acid Extraction Kits?


Low Yields

If you experience lower yields than you expect, there are many factors to consider. It is often a lysis issue, with incomplete lysis being a major cause of low yields. Incorrect binding conditions is another possibility. Make sure to use fresh high-quality ethanol (100%, 200 proof) to dilute buffers and for the binding step. Low-quality ethanol or old stocks may have taken up water, skewing the actual working concentration. Remember that if you make your wash buffer incorrectly, you may be washing away your extracted DNA or RNA!
Low Purity

If the extract is contaminated with protein, you may have started with an excess sample, increasing the risk of incomplete solubilization. If the extracts have poor A260/230 ratios the issue is usually residual salt after binding or inadequate washing. Be sure to use the highest quality ethanol to prepare wash buffers and if the problem continues, perform an additional wash step.


Impurities

Environmental samples are especially prone to impurities because humic substances solubilize easily during extraction. Such substances often behave similarly to DNA during the extraction process and are difficult to remove from the silica column. For samples prone to impurities, specialized techniques exist to remove interfering protein and humics prior to column binding.
Degradation

This is a greater concern for RNA than DNA extraction and you can find specific advice on troubleshooting RNA extraction here. RNA degradation often occurs due to improper sample storage or inefficient lysis, assuming of course samples are eluted with RNase-free water. For DNA extractions, degradation is not a huge issue if PCR is the desired application, but if you were hoping for intact high molecular weight DNA for long-range sequencing applications you should ensure to not be too harsh when lysing your sample!


PCR Clean-up Special Considerations

PCR cleanup isn’t a DNA extraction technique per se, but it is worth a mention here. Typically, PCR products are cleaned up by adding 3-5 volumes of salt per volume of the PCR reaction, followed by centrifugation of the mixture through a spin column. Although a failed clean-up is often caused by an unsuccessful PCR, it is worth saving your flow-through after column binding. If a strong PCR band didn’t make it through the column, chances are it is in the flow-through. You can always rescue it and clean it up again.
Go Forth and Use Your Nucleic Acid Extraction Kits with Confidence

As scientists, we often want to be able to troubleshoot without asking for outside help. This article should clarify some of the science around silica spin filter technology in many nucleic acid extraction kits allowing you to troubleshoot in no time. If all else fails, you will have done your homework by the time you call for technical support, and you should reach a resolution much faster, even if that is a free replacement DNA extraction kit!

Do you have any comments or questions about how nucleic acid extraction kits work? Leave a comment below.

single-cell RNA-seq: a collection

The motivation to collect resource from the web, is the problem occurring in single-cell RNA seq: cells are lost after cell-death removal kit.

Why happens? how to solve the problem?

  1. The Single-Cell Preparation Guide https://genome.duke.edu/sites/default/files/Single-Cell-Prep-Guide.pdf
  2. Removal of Dead Cells from Single Cell Suspensions for Single Cell RNA Sequencing https://assets.ctfassets.net/an68im79xiti/i1zxeDHukSQKEs2imsKYk/6a8429045a0666f0f4f1a4f908234f0b/CG000093_SamplePrepDemonstratedProtocol_-_DeadCellRemoval_RevA.pdf
  3. Why is my cell recovery low after using the Dead Cell Removal protocol (CG000093)? https://kb.10xgenomics.com/hc/en-us/articles/360044580971-Why-is-my-cell-recovery-low-after-using-the-Dead-Cell-Removal-protocol-CG000093-
  4. An optimized workflow for single-cell transcriptomics and repertoire profiling of purified lymphocytes from clinical samples https://www.nature.com/articles/s41598-020-58939-y
    5.Cell fixation and preservation for droplet-based single-cell transcriptomics https://bmcbiol.biomedcentral.com/articles/10.1186/s12915-017-0383-5
  5. Book_Single Cell Methods and PROTOCOLS http://shaleklab.com/wp-content/uploads/2019/05/2019_Book_SingleCellMethods.pdf?
  6. Droplet-based single cell RNAseq tools: a practical guide† https://pubs.rsc.org/en/content/articlelanding/2019/lc/c8lc01239c#!divAbstract
  7. Complete Guide to Understanding Single-Cell RNA-Seq https://www.activemotif.com/blog-single-cell-rna-seq
  8. What is the best way to separate the viable cells from the dead cells in suspension culture? https://www.researchgate.net/post/What_is_the_best_way_to_separate_the_viable_cells_from_the_dead_cells_in_suspension_culture
  9. A reliable strategy for single-cell RNA sequencing analysis using cryoconserved primary cortical cells https://www.sciencedirect.com/science/article/pii/S0165027020303836
  10. Sampling time-dependent artifacts in single-cell genomics studies https://www.ncbi.nlm.nih.gov/pmc/articles/PMC7212672/
  11. Fresh Frozen Human Peripheral Blood Mononuclear Cells for Single Cell RNA Sequencing: https://assets.ctfassets.net/an68im79xiti/6xwl38JmJc32Y1dgKq6dSt/32c8fc43de6dd213717b34edc44c53c3/CG00039_Demonstrated_Protocol_FreshFrozenHumanPBMCs_RevD.pdf
  12. Single Cell Set-Up: Sample Preparation Tips https://www.biocompare.com/Bench-Tips/345311-Single-Cell-Set-Up-Sample-Preparation-Tips/
  13. Quality Control of RNA-Seq Experiments: https://link.springer.com/protocol/10.1007/978-1-4939-2291-8_8
  14. Best Practices for Illumina Library Preparation https://currentprotocols.onlinelibrary.wiley.com/doi/10.1002/cphg.86

RNA-seq Sample Guidelines

The key to successfully performing RNA-seq experiments is to provide the core facility with total RNA of sufficient quality and quantity to produce a library for sequencing. The quality of the initial samples is by far the single-most important factor in the whole process.

Tissue and Cell Isolation
Investigators need to carefully choose their methods of tissue and cell isolation, as these methods directly impact the quality and quantity of RNA that is subsequently obtained. If possible, total RNA purification should immediately follow tissue/cell isolation to prevent alterations in the transcript profile. However, in some cases, immediate RNA purification is not possible. If tissues/cells must be stored prior to RNA isolation then the use of products, such as RNALater from Qiagen or similar reagents, is recommended.

The core facility strongly encourages pilot projects to confirm that the chosen methods will reproducibly create sufficient quantities of cells/tissues to ultimately yield the required amount of high-quality RNA. Once an isolation protocol or a storage and isolation protocol is established, it is important that all of the samples collected for a given project be collected with this same protocol. Variance in these techniques may result in differences in the transcript profile. These differences may later be misidentified as changes due to experimental treatment, while in reality they are artifacts of varying isolation and storage methodology.

RNA Isolation
The facility does not perform total RNA purification. We require a minimum of 500 ng of total RNA for QC and library preparation for Illumina sequencing. A number of well-established commercial kits and protocols exist for a variety of species and tissue/cell types. Investigators carefully need to determine the most appropriate methods for their tissue/cell type. The core facility strongly encourages pilot projects to confirm that the chosen method will reproducibly create sufficient quantities of high-quality total RNA from the tissue/cell of interest. Given the tremendous variety of tissue/cell types, it is difficult for us to give specific recommendations. For anyone not sure of what product to choose, we strongly encourage you to examine the products from Qiagen and Ambion (LifeTech) as a starting point. These companies have a large variety of products with decision charts to help you in choosing the right one. In addition, if you need advice that is more detailed, there are people in tech support at these companies who truly are experts in RNA isolation and have a broad experience in helping customers isolate RNA from every conceivable species/tissue/cell. We however, do have a few general recommendations regarding RNA isolation techniques based upon our experience.

We do not recommend the use of Trizol alone for total RNA isolation, as the use of Trizol often results in samples that are contaminated by proteins and organics which can inhibit the library making process. We do recommend products like RNeasy, which is a column-based purification method producing very pure preparations of total RNA. Many of our customers have found though that they get superior yields with Trizol so they perform an initial isolation with Trizol followed by a further cleanup using the RNeasy kit. We have observed that this results in very pure RNA and this method has been used successfully for RealTime PCR, microarrays, and RNA-Seq.

Accurate Determination of RNA Concentration and Purity
RNA concentration is routinely determined by measuring absorbance at 260 nm. However, it should be noted that all nucleic acids have a peak absorbance at approximately 250 -260 nm; this includes RNA, DNA, and free nucleotides. If your RNA preparation contains contaminating DNA or free nucleotides it will affect your ability to determine accurately the RNA concentration in your sample with a spectrophotometer.

RNA purity is determined by measuring the 260/280 and 260/230 ratios using a spectrophotometer. Excessive absorbance at 280 indicates the presence of protein in your sample while excessive absorbance at 230 may indicate the presence of residual phenol in your sample. Ideally, the 260/280 ratio for RNA should be approximately 2.0 and the 260/230 ration should be 2.0-2.2.These ratios can be affected by pH so we are comfortable with all ratios over approximately 1.8. Ratios that differ significantly from that measure should undergo further purification.

We recommend the use of a NanoDrop to determine RNA purity and for an initial estimate of RNA concentration. This device is easy to use and less prone to error than traditional spectrophotometers because sample dilution is usually unnecessary and pipetting errors have no effect on correct determination of concentration. All facility customers may use the one we provide in 411 Chandlee, free of charge, but please bring your own pipettor and tips. This instrument is calibrated regularly so that customers may be assured it provides an accurate measurement.

We regularly see sample concentrations reported to us that are in wide variance from the true concentration measured by our facility with calibrated a NanoDrop or other techniques such as Bioanalzyer or Qubit. If you are using your own spectrophotometer please check that it is calibrated by measuring the concentration of commercially obtained standards, use calibrated pipettors, and be careful in calculating and performing your dilutions.

RNA Sample Quality
In addition to concentration and purity, it is essential to determine the quality of RNA samples prior to library preparation for RNA-Seq, to ensure that differential degradation of samples is not mistaken for differential expression. The quality of an RNA sample (its level of degradation) can’t be determined using the NanoDrop. Sample quality is determined using an Agilent Bioanalzyer. The Bioanalyzer will produce an RNA Integrity Number, or RIN, which is an objective measure of RNA quality. RIN scores vary from 1-10, with 10 being the highest quality samples showing the least degradation.

We not only like to see high RIN scores (7-10), but we also like to see a reasonably narrow range of the scores within a set of samples, which is typically 1-1.5. We recommend re-isolation of samples that have low RIN (6 or below) or are large outliers from the average RIN of a group of samples.

Ideally we would like 5 ul of total RNA at a concentration of 100 -200ng/ul to perform Bioanalzyer analysis and to confirm sample concentration and purity. Once the total RNA samples have passed these quality measures, the samples can be used for library preparation which requires approximately 300 ng of total RNA.

If the customer plans on performing rRNA depletion, we recommend checking each total RNA sample prior to depletion to confirm quality. Following depletion, the samples should once again be assessed on the Bioanalzyer to determine the success of the depletion.

Summary
High sample quality is essential for successful RNA-Seq experiments.
Customers are responsible for total RNA isolation.
We encourage customers to perform pilot projects to determine the best tissue/cell isolation technique and RNA purification technique for their sample type.
Once a tissue/cell isolation technique and RNA purification technique has been established it should be adhered to for all samples in a project.
Determine total RNA sample purity and estimate sample concentration with a NanoDrop. The 260/280 and 260/230 ratios need to be greater than 1.8. Enough total RNA must be isolated to provide us with 500 ng for sequencing on the NextSeq or MiSeq.
Determine total RNA quality prior to library construction by having the Genomics Core Facility assess the sample using the Agilent Bioanalzyer. RIN of 7-10 and ranges of RIN from 1-1.5 for a group of samples are preferred.

Many types of RNA-seq require RNA samples of high integrity and high chemical purity – please see the sample requirements. If the tissue or cell samples are handled correctly (e.g. flash frozen and stored at -80C) standard spin column RNA extraction kits will yield RNA samples perfectly suitable for RNA-seq. Please note that samples destined for miRNA or small RNA studies need to be isolated with protocols specifically designed to retain the small molecules (please see below). Standard RNA isolation protocols will lead to the loss and sequence-specific selection of small RNA molecules. RNA samples should always be DNA-free. Nanodrop readings are more or less useless to determine RNA sample concentrations – please use fluorometric quantification instead (e.g. Qubit or Quantus instruments). The Nanodrop readings should be used to assess sample purity.

Avoiding Batch-Effects:
Both sample storage conditions and details of the RNA-isolation protocols are well-known to introduce technical variations into RNA-seq data. Because of this, it is recommended to:

Isolate the RNA-samples in one batch.
If RNA-isolations need to be carried out in several batches, they should be carried out by the same person using the same batch of reagents
If RNA-isolations need to be carried out in several batches, the samples should be randomized between the RNA isolation batches (worth discussing with a statistician or the Bioinformatics Core).

免疫共沉淀(Co-IP)中的抗体轻重链污染问题

1.    免疫共沉淀-互作网络研究经典方法

免疫共沉淀(Co-Immunoprecipitation,CoIP)是研究蛋白-蛋白间相互作用的经典方法,常用于发现蛋白的互作网络、鉴定两蛋白的互作关系。

CoIP的设计原理是,假设一种已知蛋白是某个大的蛋白复合物的组成成员,那么利用这种蛋白的特异性抗体,就可以将整个蛋白复合物从溶液中“拉”下来(常说的“pull-down”),进而可以用于鉴定这个蛋白复合物中的其他未知成员。

CoIP的特点可以概括为两点,第一是天然状态蛋白,第二是蛋白复合物。

2.哪有那么简单

上面讲了原理和流程,看起来很好理解。但研究中往往不像理论那么顺利。

在做CoIP实验过程中往往会遇到目的蛋白与抗体轻链(25kDa左右)或者抗体重链(55kDa左右)的分子量接近的情况,导致IP-WB检测时无法判断目的蛋白条带(如上图)。

如何解决这种问题,困扰了非常多的小伙伴。

3. 问题的根源

其实产生抗体轻、重链条带污染的主要原因是,二抗识别了Co-IP产物中的一抗抗体(如上图红圈所示)。

4. 解法

要解决该问题主要就是处理掉图中的轻、重链条带。

解法就是要解决上述Co-IP产物中的一抗抗体显色的问题。有如下3种方法:

1)  Co-IP抗体共价偶联到磁珠或者Agarose上——这样在洗脱的时候,抗体就不会被洗到CoIP产物中去。(例如:A10003 NHS-Activated Magarose Beads,或者M2001X系列Tag-Agarose beads产品);

 2)  IP-WB检测一抗直接标记HRP,WB实验过程中不使用二抗——这样就不会发生二抗识别CoIP产物中一抗抗体(例如:M200系列HRP标记标签抗体);

 3)  使用一款只识别天然构象抗体的二抗——由于WB过程中,CoIP产物中一抗抗体变性,该二抗不会识别产生条带。(例如:AbSmart系列二抗);

上述3种方法中:购买共价偶联好的Tag-Agarose beads或者HRP标记的标签抗体,使用起来很方便,作为实验首选。

但是绝大多数一抗是没有HRP标记的或者共价偶联beads的,所以很多实验室在做内源性蛋白Co-IP实验时就会很烦恼,这时候使用避免抗体轻重链的AbSmart系列二抗,就可以有效地解决这类问题,作为内源性蛋白的Co-IP实验的首选。

另外如果Co-IP之后,需要质谱鉴定互作蛋白或修饰时,为了排除质谱检测时抗体的干扰,可以选择使用NHS- Activated Magarose Beads来共价偶联一抗,然后做CoIP实验将产物进行质谱检测,这样可以大大提高质谱检出蛋白的数量和修饰位点的灵敏度。

下面给大家分享一个实验结果案例:

蛋白质表达的常用标签

An affinity tag, just like an identity card, allows you to identify and separate your protein from hundreds of others (a VIP status, sort of!). Protein purification affinity tags enable your protein to bond with resin-attached molecules, leaving behind other, non-tagged proteins (no tag, nothing to brag).

This short introduction to commonly used affinity tags will help you select the best one for your experimental conditions and obtain a joyful, “proteinaceous” reward for your hard work.


6X-His (hexahistidine) Tag

Hexahistidine tags are one of the most commonly used affinity tags. It utilizes the ability of histidine to coordinate with transition metal ions, such as Ni2+, Co2+, and Cu2+. Owing to its small size, it is non-toxic and does not interfere with the immunogenicity or physiochemical properties of the protein.

One should proceed with caution if using denaturing agents, such as urea, or reducing agents, such as dithiothreitol (DTT), as they may disturb the metal-ion resin.

A 6x-His tag is a great option for experiments involving a prokaryotic expression system. I achieved >95% purity of a cytoplasmic protein from Leishmania sp. in a single step using a Ni-nitrilotriacetic acid (NTA) resin. Moreover, you can regenerate and re-use the resin numerous times (a boon during fund crunch in the lab), given that conditions are amenable during each purification cycle.


Glutathione-S-transferase (GST) Tag

This tag works on the principle of GST’s affinity for immobilized glutathione. A GST tag can increase the solubility of your expressed protein in a prokaryotic system. You can remove the 26-kDa tag while the fusion protein is still bound to the glutathione resin, or you can elute the tagged protein. Tag removal is recommended as it may affect the properties of the fusion protein.

The elution procedure is mild, thus preserving the protein’s immunogenicity and properties. GST-based purification gives good yields. However, if your purification procedure requires the use of reducing agents, such as DTT or \beta-mercaptoethanol (\beta-ME), denaturing agents, such as urea or guanidine HCl, or detergents, GST-based chromatographic purification may be less effective.

Watch out for co-elution of an unwelcomed guest (70-kDa E. coli chaperonin) with your protein. In such a situation, treat the lysate with 5 mM MgCl2 and ATP before eluting.


Maltose-Binding Protein (MBP)

The main aim of this tag is to increase the solubility of the fusion protein, thus it may be your tag of choice when purifying membrane or lipophilic proteins. MBP-based purification helped me obtain decent expression and yield of a membrane protein that was difficult to achieve with a 6X-His-tag.

This tag gives a good yield; however, the size of the MBP tag (46 kDa) could be a concern if your downstream application is immunization. In such a scenario, you should consider removing the tag to avoid altering the protein’s immunogenicity.

The MBP-fusion protein bound to an amylose resin is eluted by running maltose in the elution buffer. This method is fairly resistant to denaturants, reducing agents, and detergents. However, any amylase activity in the cell lysate may reduce the efficiency of the amylose resin.


Calmodulin-Binding Protein (CBP)

This procedure utilizes the C-terminal domain of myosin light-chain kinase (MLCK) as a purification tag. In the presence of low levels of calcium, CBP has a high affinity for resin-attached calmodulin. Combined with superaffinity, smaller (4 kDa) size, and mild elution conditions, CBP tags are good if you are dealing with a delicate or finicky protein.

It can withstand low levels of notorious (yet sometimes essential) components such as denaturants, detergents, and reducing agents.


Streptavidin/Biotin-Based Tag

Who is not aware of the great affinity that biotin and streptavidin have for each other? Well, you can utilize it for protein purification by biotinylating your protein of interest and making it ‘pretty’ in avidin’s eyes (avidin-attached resins)!

Non-specific binding during purification is negligible in this method; however, the use of denaturing agents is a big ‘no-no’. This is widely used for immobilizing biotinylated fusion proteins on surface plasmon resonance (SPR) chips for functional studies.


Strep-Tag® Peptide System

This is a modification of the streptavidin/biotin-based purification system. The target protein is fused to a short peptide (9 amino acids) known as Strep-tag, which binds to a streptavidin. The protein is eluted by using biotin in the elution buffer. This system achieves a high purification efficiency even with low-expressing proteins.

The Strep-Tactin®/Strep-tag II system achieves even higher purification efficiency by utilizing engineered forms of streptavidin and an eight-peptide tag. This system is free from the drawbacks associated with metal-ion based resins, which can cause protein aggregation and protein precipitation by chelation. Additionally, you can reuse the resin multiple times.

Once you are finished with your purification, you can always choose to remove the tag, depending upon downstream experiments/assays. So, go ahead and choose a tag based on your protein’s comfort and liking.

Feel free to share your experiences working with the protein purification affinity tag of your choice in the comments below. I wish you good luck in achieving high protein yields!


References

Kimple M.E., et al. Overview of affinity tags for protein purification. Curr Protoc Protein Sci, Chapter 9, Unit 9.9 (2013). doi: 10.1002/0471140864.ps0909s36
Zhao X., et al. Several affinity tags commonly used in chromatographic purification. J Anal Methods Chem, 581093 (2013). doi: 10.1155/2013/581093

Experimental Considerations for scRNA-seq in Vaccinology

(1) Research question considerations

  • (a)Ample consideration of the particular research question to be answered is required for any experimental design, but in particular scRNA-seq experiments
  • (b)Potential questions that can be asked in scRNA-seq experiments
    1. Does vaccination result in previously uncharacterised single-cell states?
    2. What is the temporal sequence of cellular processes taking place after vaccination?
    3. How does T cell and/or B cell clonal diversity change in response to vaccination?
    4. What are the transcriptional differences among vaccine reactive/antigen-specific cells?
    5. To what extent are vaccine-induced transcriptional changes reflected at the cellular (bulk vs. single-cell sequencing) and protein level (transcriptomics vs. proteomics)?
    6. What are the single-cell transcriptional differences in vaccine response between vaccines A and B?
    7. What is the single-cell transcriptional profile in peripheral lymphocytes (or organ) given a particular vaccine platform (e.g., virus-like particles), regardless of the antigen that is delivered?
  • (c)Other specific experimental considerations will influence experimental design
    • (i) Breadth vs. depth
      1. Are lowly expressed genes of particular interest? For transcripts that are lowly expressed (e.g., transcription factors), full length sequencing approaches may be better than 3′ methods [152]. In this case, the amount of sequencing should also be considered such that “saturation” is reached; that is, further sequencing does not lead to the discovery of more unique transcripts
      2. Are rare cell types to be profiled? Increasing cell number and maintaining read depth relatively low allows more power to detect rare cell populations (that may exist at <1% in frequency) [5]. It has been suggested that to estimate several important gene characteristics, the most favourable sequencing depth is around one read per cell per gene [153]. Alternatively, enrich the cell type of interest by using FACS, followed by scRNA-seq and use methods such as GateID to predict “nonintuitive” gating strategies based on scRNA-seq data [154]
    • (ii) Will comparisons be made between different conditions (e.g., prime alone vs. prime-boost)?
    • (iii) What are the qualities and expression levels of the marker genes of cell types of interest? Transcriptional bursting can result in substantially different transcript quantities and apparent gene expression levels [155]
    • (iv) What is the overall budget of the project? Cost/cell profiled is an often-used metric for budgeting scRNA-seq experiments
    • (v) What facilities and expertise are available?
    • (vi) Has technical and experimental advice been sought by nonconventional means (consider the active scRNA-seq community on Twitter (particularly #scRNAseq and #scQA), ResearchGate, medRxiv, bioRxiv, EMBI-EBI training (https://www.ebi.ac.uk/training), and the Galaxy platform (https://usegalaxy.org/))

(2)

Sample preparation and processing considerations

  • (a)Processing samples up to the point where scRNA-seq can be performed is a process that can greatly affect the outcome of the experiment
    1. Are there unchangeable constraints on sample collection/processing times? What effects, if any, will these have on the results?
    2. Do samples have to be processed immediately or is there a window where gene expression will not be affected, without specific preservation?
    3. Will the samples be preserved (e.g., flash frozen, fresh frozen, or formalin-fixation and paraffin-embedding) [156]?
  • (b)scRNA-seq usually requires mechanical or enzymatic dissociation of samples to produce a single-cell suspension. Certain factors will affect this process
    1. How fragile/robust are the samples?
    2. How well is the tissue dissociated?
    3. Which single-cell isolation procedure will be used (e.g., microdissection, reverse emulsion droplets, FACS into plates, and/or nanowell isolation)?
    4. Are there preexisting protocols in the published literature that describe isolation techniques from the sample of interest (consider published, preprint, and commercial (e.g., 10x Genomics technical notes) literature)?
    5. Will the cells be preserved (e.g., cryopreservation using DMSO, methanol fixation, or storage in commercially available formulations to preserve cells and their RNA) [157]?
    6. Can a method be used that does not dissociate tissue (e.g., Slide-seq) as a baseline to check for dissociation effects? This will likely add extra cost and require additional technical expertise
  • (c)Once cells (or nuclei) are in a suspension, the starting point for RNA capture is achieved
    1. Which is more apt and feasible to answer your specific research question, nuclei or cells isolated from the sample [134]? Nuclei-derived transcripts have a higher intronic/exonic read ratio as they contain proportionally more pre-mRNAs and there is potential that a narrower time period is profiled as mRNAs in the cytoplasm may have existed for longer
    2. What are the characteristics of the cells of interest (e.g., size and adherability)? Volume can vary widely cell-to-cell, this affects the absolute number of transcripts and can be reflected in the detected number of genes per cell [158]. Adherability of a cell may affect processes before sequencing, such as FACS
    3. What quantity of input material (cells or nuclei) is there?
  • (d)Assessing RNA quality. Before embarking on costly library preparation for every sample, it is important to ensure that the RNA has not significantly degraded:
    1. RNA quality is typically measured using the RNA Integrity Number (RIN) algorithm [159]. This test is performed by isolating RNA from a sample of interest (typically bulk or 10s-100s of cells) and performing RNA microcapillary electrophoresis. The algorithm uses multiple features from the resultant electropherogram trace to score quality of the RNA from 1 (most degraded) to 10 (least degraded-highest integrity)
    2. Is there enough of the sample to produce a RIN score test on each sample? If the site, conditions, or timing of sample collections is variable, it may lead to differences in RNA degradation between samples (and batch effects, discussed below). If a RIN score step can be built into each experiment before embarking on library preparation, then it can prevent spending money on low-quality samples

(3)

Replicates, scale, sequencing, and batch considerations

  • (a)Batch effects
    • (i) Batch effects are random technical artefacts which occur during handling/processing. If batches correspond to different biological conditions, then it is largely impossible to determine what differences are biological vs. artefacts
    • (ii) Avoid batch effects by
      1. sorting cells from different biological conditions into different wells of the same plate
      2. using genetic variants to post hoc assign sequenced cells back to their genetically unique donor
      3. using the expression of an inserted genetic construct (not recommended)
      4. using barcoded antibodies (Cell Hashing) to label samples after dissociation, but before cell-capture step, to multiplex samples [13, 160]
    • (iii) Batch effects may be corrected by a number of bioinformatics tools and/or packages [161, 162]
  • (b)Experiment scale
    1. How many cells will be tested largely depends on the level of heterogeneity of the sample and on the number of available cells
    2. Plate-sorted single cells are limited in the amount that can be handled compared to microfluidic platforms, which enable studies with several thousands of cells (Figure 1)Figure 1scRNA-seq technologies that have been critical to allowing increments in experiment scale. Achievements over the past three years have more or less continued this pace; for example, combinatorial fluidic preindexing has increased the throughput of droplet-based single-cell RNA sequencing up to 15-fold. Figure adapted from references [133, 163].
  • (c)Method of amplification
    1. Either exponential PCR-based amplification or linear in vitro transcription (IVT) amplification is usually used. IVT incorporates less PCR bias and erroneous bias as it is based on an unamplified RNA template [164]
  • (d)Transcript position
    1. Some protocols provide full-length transcript data, whereas others amplify only the 3′ or 5′ ends of the transcripts
    2. Non-full-length transcript methods allow increased throughput of cells, while full-length transcripts are advantageous if splice variants are important, looking to detect genetic variants or when studying species that have poorly annotated genomes
  • (e)Sensitivity
    1. This is the ability of an assay to capture an mRNA molecule from a single cell within the final library. Low sensitivity protocols have a disproportionate effect on weakly expressed genes (e.g., genes encoding cytokines)
    2. If weakly expressed genes are to be evaluated, consider higher sensitivity methods or consider “clean-up” procedures such as rRNA removal [165]
  • (f)Ultimately, the particular protocol must be decided on an individual experiment basis. It is also important to note that while scRNA-seq methods have greater sensitivity than bulk RNA-seq methods, bulk methods have higher accuracy [166]

From: https://www.ncbi.nlm.nih.gov/pmc/articles/PMC7411487/

FAQ about preparing RNA for sequencing

Overview of RNA Library Preparation

Illumina TruSeq Stranded mRNA Kit: Initiates library preparation using oligo-dT beads to capture RNA species containing a polyA tail. Following polyA RNA enrichment, the RNA is chemically fragmented and random primed for reverse transcription. The average insert size of libraries constructed with the TruSeq Stranded mRNA Library Prep Kit is 200 bp and approximately 90-95% of the sequence reads derived from these libraries align to RNA exons. The recommended input for library construction ranges from 100 to 1,000 ng of total RNA which should be delivered in a 12-30 µL volume. The kit works best with high quality RNA (RNA integrity number of 8 or higher) from any species in which mRNA contains a polyA tail.

Illumina TruSeq Stranded Total RNA Library Prep Kit: Initiates library preparation with the removal of rRNA using Ribo-Zero, a reagent consisting of biotinylated oligonucleotides that are complimentary to rRNA. The Ribo-Zero product line includes solutions to remove cytoplasmic and mitochondrial rRNA from total RNA samples purified from animal sources or cytoplasmic, mitochondrial, and chloroplast rRNA from plant samples. Following rRNA removal, the remaining RNA is chemically fragmented and random primed for reverse transcription. The average insert size of libraries constructed with the TruSeq Stranded Total RNA Library Prep Kit is 200 bp and approximately 70-90% of the sequence reads derived from these libraries align to RNA exons. The recommended input for library construction ranges from 100 to 1,000 ng of total RNA which should be delivered in a 10-15 µL volume. The kit is compatible with a wide range of sample quality including highly degraded RNA purified from formalin-fixed, paraffin embedded tissues. However, libraries constructed with this kit using RNA samples derived from formalin-fixed, paraffin embedded tissues routinely exhibit a high abundance of sequence reads that align to introns (40-60%). In all cases, it is essential that RNA samples are treated with DNase to minimize the contribution of sequence reads derived from residual genomic DNA in the sample. Failure to treat with DNase or inefficient DNase treatment can result in a significant fraction of intergenic reads in the sequence data.

Illumina TruSeq RNA Exome Kit: Enables the enrichment of coding regions within the transcriptome using a hybridization reaction with biotinylated oligonucleotides that are complimentary to the exome. The average insert size of libraries constructed with the TruSeq RNA Exome Kit is 150 bp and approximately 80-90% of the sequence reads derived from these libraries align to RNA exons. The recommended input for library construction ranges from 5 to 100 ng of total RNA which should be delivered in a 10-15 µL volume. The kit is compatible with a wide range of sample quality and significantly improves the percent of useful sequencing reads obtained from libraries derived from highly degraded RNA purified from formalin-fixed, paraffin embedded tissues. In all cases, it is essential that RNA samples are treated with DNase to minimize the contribution of sequence reads derived from residual genomic DNA in the sample.

New England BioLabs NEBNext Ultra II Directional RNA Library Prep: Enables removal of cytoplasmic and mitochondrial rRNA from a sample using a hybridization to oligonucleotides that are complimentary to rRNA that is followed by an RNase H digestion protocol. The rRNA Removal solution that is used with this kit was designed to target human, mouse, and rat rRNA, but it may be able to effectively remove rRNA from other animal species. Following rRNA removal, the RNA sample is chemically fragmented and random primed for reverse transcription. The average insert size of libraries constructed with the NEBNext Ultra II Directional RNA Library Prep Kit is 200 bp and approximately 50-70% of the sequence reads derived from these libraries align to RNA exons. The recommended input for library construction ranges from 5 to 100 ng of total RNA which should be delivered in a 10-15 µL volume. This kit is compatible with a wide range of sample quality, however, in all cases it is essential that RNA samples are treated with DNase to minimize the contribution of sequence reads derived from residual genomic DNA in the sample.

Frequently Asked Questions

1. What quantity of RNA is required for library preparation?

Illumina TruSeq Stranded mRNA: A quantity of 100 to formalin-fixed, paraffin embedded ng of total RNA in a volume of 10-30 µL is recommended for constructing a library with the Illumina TruSeq Stranded mRNA Library Prep Kit.

Illumina TruSeq Stranded Total RNA: A quantity of 100 to 1,000 ng of total RNA in a volume of 10-15 µL is recommended for constructing a library with the Illumina TruSeq Stranded Total RNA Library Prep Kit with Ribo-Zero.

Illumina TruSeq RNA Exome: A quantity of 5 to 100 ng of total RNA in a volume of 10-15 µL is recommended for constructing a library with the Illumina Illumina TruSeq RNA Exome Kit.

New England BioLabs NEBNext Ultra II Directional RNA: A quantity of 5 to 100 ng of total RNA in a volume of 10-15 µL is recommended for constructing a library with the NEBNext Ultra II Directional RNA Library Prep.


2. What is the recommended concentration of RNA for library preparation?

Illumina TruSeq Stranded mRNA: RNA samples should be provided at a concentration of 5-200 ng/µL for samples that will be used for library construction with the Illumina TruSeq Stranded mRNA Library Prep Kit.

Illumina TruSeq Stranded Total RNA: RNA samples should be provided at a concentration of 10-200 ng/µL for samples that will be used for library construction with the Illumina TruSeq Stranded Total RNA Library Prep Kit.

Illumina TruSeq RNA Exome: RNA samples should be provided at a concentration of 1-50 ng/µL for samples that will be used for library construction with the Illumina TruSeq RNA Exome Kit.

New England BioLabs NEBNext Ultra II Directional RNA: RNA samples should be provided at a concentration of 1-10 ng/µL for samples that will be used for library construction with the NEBNext Ultra II Directional Library Prep Kit.


3. What quality of RNA (RNA integrity number [RIN]) is recommended for library preparation?

Illumina TruSeq Stranded mRNA: RNA samples with a RIN value between 8.0 and 10.0 are recommended for library preparation with the Illumina TruSeq Stranded mRNA Library Prep Kit. Samples with RIN values below 8.0 will exhibit increased levels of 3’ bias which can compromise the ability to compare gene expression profile data between different samples.

Illumina TruSeq Stranded Total RNA: RNA samples with a RIN value between 1.0 and 10.0 can be used for library preparation with the Illumina TruSeq Stranded Total RNA Library Prep Kit. This kit also works well with RNA samples that are purified from formalin-fixed, paraffin embedded tissues.

Illumina TruSeq RNA Exome: RNA samples with a RIN value between 1.0 and 10.0 can be used for library preparation with the Illumina TruSeq RNA Exome Kit. This kit also works well with RNA samples that are purified from formalin-fixed, paraffin embedded tissues.

New England BioLabs NEBNext Ultra II Directional RNA: RNA samples with a RIN value between 2.0 and 10.0 can be used for library preparation with the NEBNext Ultra II Directional Library Prep Kit.


4. Does the HTG Shared Resource perform sample quality assays prior to library construction?

All Kits: The HTG Shared Resource performs a Qubit assay to measure sample concentration and an Agilent ScreenTape Assay to measure the quality of RNA samples prior to library preparation. If a sample fails to meet quality specifications for the library preparation protocol that was chosen during the experiment order process, the researcher will be contacted prior to proceeding with library preparation.


5. What purification kits are recommended for extraction of RNA from tissue culture cells?

All Kits: Total RNA should be purified from tissue culture cells using a spin column such as those available in the Qiagen RNeasy Mini Kit (cat# 74104), Qiagen miRNeasy Mini Kit ((cat#2107004), or the Zymo Research Direct-zol RNA MiniPrep Kit (cat# R2050, R2051, R2060, R2061, or similar). In all cases, it is recommended to include on-column DNase treatment to minimize co-purification of DNA in the RNA sample. Zymo Research kits include DNase whereas Qiagen kits require DNase to be purchased separately (cat#79254).


6. What purification kits are recommended for extraction of RNA from tissues?

All Kits: Total RNA should be purified from tissue samples using a spin column such as those included with kits available through Qiagen or Zymo Research. Kits that initiate the purification process with the addition of QIAzol or Trizol significantly improve the purity of RNA from tissues that are high in fat, mucous, or yolk content. We recommend kits such as the Qiagen Lipid Tissue Mini Kit (cat# 74804), Qiagen miRNeasy Mini Kit (cat#2107004), or the Zymo Research Direct-zol RNA MiniPrep Kit (cat# R2050, R2051, R2060, R2061, or similar). In all cases, it is recommended to include DNase treatment to minimize the co-purification of DNA. Zymo Research kits include DNase whereas Qiagen kits require DNase to be purchased separately (cat#79254).


7. What purification kits are recommended for extraction of RNA from formalin-fixed, paraffin embedded tissues?

All Kits: Total RNA can be purified from formalin-fixed, paraffin embedded tissues using the Qiagen AllPrep DNA/RNA FFPE Kit (cat#80234), the Ambion RecoverAll Total Nucleic Acids Kit (cat#AM1975), or the Zymo Research Quick-RNA FFPE Kit (cat#1008). In all cases, it is recommended to include DNase treatment to minimize co-purification of DNA in the RNA sample. The Ambion and Zymo Research kits include DNase whereas Qiagen kits require DNase to be purchased separately (cat#79254).


8. Should RNA be treated with DNase during the purification process?

All Kits: It is important to treat all RNA samples with DNase as residual DNA in the sample can result in a substantial volume of genomic DNA-derived reads in RNA sequencing data. Both the Qiagen RNeasy kits and the Zymo Research RNA Purification kits allow for the optional inclusion of applying DNase (Qiagen cat#79254 and Zymo cat# E1010) to the spin column while purifying a RNA sample.


9. Do you recommend using a Qiagen kit that includes a gDNA eliminator column when purifying RNA samples?

All Kits: We advise against reliance on a gDNA Eliminator Column to remove residual DNA during the RNA purification process. In our experience, the gDNA Eliminator Column is a less effective solution for removal of residual DNA when compared to treating the sample with DNase on the spin column. The use of these columns can result in excess of 60-80% intergenic reads in RNA sequencing data. In conversations with Qiagen, their technical support team recommended that one can always include on-column DNase treatment during the RNA purification process when preparing samples for more sensitive experiments such as next generation sequencing.


10. Does the HTG Shared Resource provide access to a Qiagen TissueLyzer?

All Kits: A Qiagen TissueLyzer LT is available at the HTG Shared Resource for extraction of RNA from tissue samples. The TissueLyzer LT is able to simultaneously disrupt up to 12 tissues by vigorously shaking the samples in the presence of RNA purification buffer containing a stainless-steel bead. A carrying bag is available to transport the instrument to your lab.


11. What buffer should be used to elute RNA from a spin column?

All Kits: RNA should be eluted from spin columns or diluted to a lower concentration using RNase-free water.


12. Should I add carrier RNA/DNA when purifying low input samples?

All Kits: We recommend avoiding the addition of carrier RNA/DNA when purifying nucleic acid samples. Carrier products added to a sample can function as template during the library preparation process and substantially contribute to the sequence reads. These products also interfere with accurate assessment of the concentration and quality of the target RNA sample.


13. How should I store purified RNA samples?

All Kits: RNA samples should be stored at -80°C in either Eppendorf LoBind tubes (cat# 022431048) or Axygen Maxymum Recovery tubes (cat#MCT-150-L-C), both of which minimize the non-specific binding of dilute RNA solutions to the surface of the plastic tube.


14. Do you recommend using either Trizol or phenol/chloroform as a stand-alone reagent for RNA extraction?

All Kits: The use of organic extraction reagents such as Trizol or phenol/chloroform as a stand-alone method for RNA purification is strongly discouraged. The quality of RNA purified by these protocols tends to be lower due to organic carry-over and the co-precipitation of biomolecules which are inhibitory to downstream enzymatic steps in the library preparation process.


15. Does the HTG Shared Resource provide RNA purification services?

All Kits: The HTG Shared Resource does not provide RNA purification services. RNA Purification services can be obtained from the Biorepository and Molecular Pathology Shared Resource (contact john.oshea@hci.utah.edu) or the Cellular Translational Research Core Facility (contact colin.maguire@utah.edu). In all cases you should request that RNA purification includes DNase treatment of the sample.


16. Is the NanoDrop a good choice for measuring the concentration of an RNA sample?

All Kits: An A260 measurement on a NanoDrop reflects absorbance by any form of nucleic acid including DNA, RNA, small nucleic acid fragments, or nucleotides. The NanoDrop may provide useful information when screening the concentration of RNA samples that are above 10 ng/µL if the A260/230 ratio is between the range of 1.6 to 2.4. However, the use of fluorescent dyes such as those available for use with the Qubit, provide a more accurate solution for measuring the concentration of an RNA sample.


17. How should I measure the concentration of my RNA samples?

All Kits: The concentration of RNA samples should be measured using either the Qubit RNA Broad Range Assay Kit (Fisher cat#Q10210) or the Qubit RNA High Sensitivity Assay (Fisher cat#Q32852).


18. Does the HTG Shared Resource provide researchers with access to a Qubit instrument?

All Kits: The HTG Shared Resource provides a Qubit 2.0 instrument in the entryway to the laboratory that can be used by university researchers. Required reagents for measuring RNA concentration include either the Qubit RNA Broad Range Assay Kit (Fisher cat#Q10210) or the Qubit RNA High Sensitivity Assay (Fisher cat#Q32852) in addition to Qubit Assay Tubes (Fisher cat#Q32856).


19. How can I determine if Ribo-Zero is compatible with the species that I work with?

Illumina TruSeq Stranded Total RNA: The HTG Shared Resource supports the following Ribo-Zero products. Species compatibility information relevant to the Ribo-Zero products can be reviewed on Illumina’s website.

  • Ribo-Zero Gold: removes cytoplasmic and mitochondrial rRNA from human, mouse, rat, and other animal-derived RNA samples.
  • Ribo-Zero plant: removes cytoplasmic, mitochondrial, and chloroplast rRNA from plant RNA samples.
  • Ribo-Zero Globin: removes cytoplasmic and mitochondrial rRNA in addition to globin mRNA from human, mouse, rat, and other animal-derived RNA samples.

20. How many reads are recommended for each RNA-seq library?

Illumina TruSeq Stranded mRNA, Illumina TruSeq RNA Exome: It is recommended to have a minimum of 20-30 million read-pairs for libraries constructed with the TruSeq Stranded mRNA or the TruSeq RNA Exome Kit.

Illumina TruSeq Stranded Total RNA, New England BioLabs NEBNext Ultra II Directional RNA: It is recommended to have a minimum of 25-50 million read-pairs for RNA libraries derived from human or mouse samples that were constructed using a rRNA depletion reagent such as Illumina Ribo-Zero or NEB rRNA Removal Solution.


21. What percentage of sequence reads from an RNA-seq library will align to exons?

Illumina TruSeq Stranded mRNA: Sequence reads derived from libraries constructed with the Illumina TruSeq Stranded mRNA Library Prep Kit typically exhibit 90-95% alignment to exons (coding plus UTR), 2-6% to introns and 1-3% to intergenic sequences.

Illumina TruSeq Stranded Total RNA: Sequence reads derived from libraries constructed with the Illumina TruSeq Stranded Total RNA Library Prep kit with Ribo-Zero typically exhibit 60-80% alignment to exons (coding plus UTR), 5-20% to introns, and 2-10% to intergenic sequences. Samples purified from formalin-fixed, paraffin embedded tissues typically exhibit a higher percentage (20-40%) of reads that align to introns. A failure to efficiently treat an RNA sample with DNase may result in a much higher percentage of reads that align to intergenic sequences.

Illumina TruSeq RNA Exome: Sequence reads derived from libraries constructed with the Illumina TruSeq RNA Exome Kit typically exhibit 85-90% alignment to exons (coding plus UTR), 5-10% to introns, and 1-5% to intergenic sequences.

New England BioLabs NEBNext Ultra II Directional RNA: Sequence reads derived from libraries constructed with the NEBNext Ultra II Directional Library Prep Kit typically exhibit 50-60% alignment to exons (coding plus UTR), 20-30% to introns, and 5-10% to intergenic sequences. A failure to efficiently treat an RNA sample with DNase may result in a much higher percentage of reads that align to intergenic sequences.


22. Can I construct my own libraries for sequence analysis on an Illumina sequencer?

All Kits: Although the HTG Shared Resource is setup to support all aspects of the sequencing process for the Illumina platform, we also welcome libraries constructed by individual research labs. Prior to sequencing, these libraries will experience multiple quality control assays which include a Qubit dsDNA HS Assay, Agilent ScreenTape Assay, and Kapa BioSystems qPCR. Although we highly qualify all libraries that are sequenced on the Illumina platform, we are unable to guarantee the yield of sequence reads when individual researchers construct their own sequencing libraries due to variability in library quality that is outside of our control.


23. Should I be concerned if adapter dimer products are present in the RNA-seq library that I constructed?

All Kits: Adapter dimer products, which appear as 120 to 140 bp bands on a DNA TapeStation Assay, are able to hybridize to Illumina sequencing flow cells more efficiently than library molecules that contain cDNA inserts. The researcher should be aware that a disproportionate quantity of adapter-only reads may be present in sequence data delivered from libraries containing adapter-dimer products. An Illumina reference suggests that 5% adapter dimer in a sequencing library can result in adapter dimers contributing as much as 65% of the sequence reads from a NovaSeq flow cell.


24. How does the HTG Shared Resource qualify libraries prior to sequencing?

All Kits: Quality control assays are performed to validate libraries prior to sequence analysis on the NovaSeq, HiSeq 2500, and MiSeq instruments. These assays include the following: Qubit dsDNA High Sensitivity Assay (library concentration), Agilent ScreenTape Assay (size distribution), and qPCR with the Kapa Library Quantification Kit for Illumina Platforms (normalize library representation in preparation for pooling). The cost for these quality control assays is included as part of library preparation when the HTG Shared Resource constructs the library. Alternatively, an additional fee is charged per sample when researchers construct libraries within their own lab.


25. What sequences are used for adapter trimming of RNA-seq libraries?

All Kits: The following sequences can be used for trimming adapters from the 3’ end of sequence reads originating from RNA-seq library prep kits supported by the HTG Shared Resource:

Read 1: AGATCGGAAGAGCACACGTCTGAACTCCAGTCA
Read 2: AGATCGGAAGAGCGTCGTGTAGGGAAAGAGTGT


26. Do RNA-seq libraries include both mRNA and miRNA species?

All Kits: The construction of mRNA-centric sequencing libraries includes a step in which random primers are used to initiate reverse transcription. Random priming does not work in retaining full sequence information for miRNA molecules. In contrast, miRNA libraries are constructed through the direct ligation of adapters to the ends of small RNA molecules using RNA ligases. These ligases work well with small molecules but their efficiency is significantly diminished with RNA molecules exceeding 100 nucleotides.


27. Do RNA library prep kits work with prokaryote samples?

Illumina TruSeq Stranded Total RNA: Illumina discontinued the Ribo-Zero Bacteria stand-alone product on November 2, 2018. The HTG Shared Resource previously substituted this product into the TruSeq Stranded Total RNA Library Prep Kit to enable support for rRNA-depleted libraries from bacterial RNA samples. Although we do still have some Ribo-Zero Bacteria reagent, this is only a short-term solution and we will be reviewing alternative kits for supporting RNA-seq library preparation with bacterial samples.


28. How long will sequencing data from by genomic DNA libraries be available for download on the GNomEx server?

All Kits: Sequencing data will be available on the GNomEx server for a period of approximately 6 months. The Bioinformatics Shared Resource has enabled an option for University of Utah laboratories to migrate sequencing data to Seven Bridges for long-term storage. Please contact the Bioinformatics Shared Resource for information on creating an account on Seven Bridges to enable transfer of data. Otherwise, researchers can explore other options for data storage but they should be aware that the GNomEx server is unable to support a solution in excess of 6 months.


29. Does the HTG Shared Resource provide assistance with analysis of sequence data?

All Kits: The HTG Shared Resource does not provide sequence analysis services. Please contact the Bioinformatics Shared Resource (bioinformaticshelp@bio.hci.utah.edu) for assistance.

From: https://uofuhealth.utah.edu/huntsman/shared-resources/gba/htg/library-prep/rna-sequencing.php

基于CRISPR/Cas技术的基因激活和抑制策略

References

  1. Jinek M, et alA programmable dual-RNA-guided DNA endonuclease in adaptive bacterial immunity. Science. 2012;337(6096):816-21. DOI: 10.1126/science.1225829.
  2. La Russa MF, et alThe New State of the Art: Cas9 for Gene Activation and Repression. Mol Cell Biol. 2015;35(22):3800-9. DOI: 10.1128/MCB.00512-15.
  3. Gilbert LA, et alCRISPR-mediated modular RNA-guided regulation of transcription in eukaryotes. Cell. 2013;154(2):442-51. DOI: 10.1016/j.cell.2013.06.044.
  4. Yang J, et alGenome-Scale CRISPRa Screen Identifies Novel Factors for Cellular Reprogramming. Stem Cell Reports. 2019;12(4):757-71. DOI: 10.1016/j.stemcr.2019.02.010.
  5. Konermann S, et alGenome-scale transcriptional activation by an engineered CRISPR-Cas9 complex. Nature. 2015;517(7536):583-8. DOI: 10.1038/nature14136.
  6. Gilbert LA, et alGenome-Scale CRISPR-Mediated Control of Gene Repression and Activation. Cell. 2014;159(3):647-61. DOI: 10.1016/j.cell.2014.09.029.
  7. Horlbeck MA, et alNucleosomes impede Cas9 access to DNA in vivo and in vitro. eLife. 2016;5. DOI: 10.7554/eLife.12677.
  8. Joung J, et alGenome-scale CRISPR-Cas9 knockout and transcriptional activation screening. Nat Protoc. 2017;12(4):828-63. DOI: 10.1038/nprot.2017.016.
  9. Horlbeck MA, et alCompact and highly active next-generation libraries for CRISPR-mediated gene repression and activation. Elife. 2016;5. DOI: 10.7554/eLife.19760.
  10. Doench JG. Am I ready for CRISPR? A user’s guide to genetic screens. Nat Rev Genet. 2018;19(2):67-80. DOI: 10.1038/nrg.2017.97.
  11. Doench JG, et alRational design of highly active sgRNAs for CRISPR-Cas9-mediated gene inactivation. Nat Biotechnol. 2014;32(12):1262-7. DOI: 10.1038/nbt.3026.
  12. Sanson KR, et alOptimized libraries for CRISPR-Cas9 genetic screens with multiple modalities. Nat Commun. 2018;9(1):5416. DOI: 10.1038/s41467-018-07901-8.
  13. Lennox KA, et alCellular localization of long non-coding RNAs affects silencing by RNAi more than by antisense oligonucleotides. Nucleic Acids Res. 2016;44(2):863-77. DOI: 10.1093/nar/gkv1206.
  14. Khan AA, et al. Transfection of small RNAs globally perturbs gene regulation by endogenous microRNAs. Nat Biotechnol. 2009;27(6):549-55. DOI: 10.1038/nbt.1543.
  15. Rayner E, et alCRISPR-Cas9 Causes Chromosomal Instability and Rearrangements in Cancer Cell Lines, Detectable by Cytogenetic Methods. CRISPR J. 2019;2(6):406-16. DOI: 10.1089/crispr.2019.0006.
  16. Schwertman P, et alRegulation of DNA double-strand break repair by ubiquitin and ubiquitin-like modifiers. Nat Rev Mol Cell Biol. 2016;17(6):379-94. DOI: 10.1038/nrm.2016.58.
  17. Zhu S, et al. Genome-scale deletion screening of human long non-coding RNAs using a paired-guide RNA CRISPR-Cas9 library. Nat Biotechnol. 2016;34(12):1279-86. DOI: 10.1038/nbt.3715.
  18. Chavez A, et alHighly efficient Cas9-mediated transcriptional programming. Nat Methods. 2015;12(4):326-8. DOI: 10.1038/nmeth.3312.
  19. Stopka T, et alPU.1 inhibits the erythroid program by binding to GATA-1 on DNA and creating a repressive chromatin structure. EMBO J. 2005;24(21):3712-23. DOI: 10.1038/sj.emboj.7600834.
  20. Jost M, et alCombined CRISPRi/a-Based Chemical Genetic Screens Reveal that Rigosertib Is a Microtubule-Destabilizing Agent. Mol Cell. 2017;68(1):210-23 e6. DOI: 10.1016/j.molcel.2017.09.012.
  21. Datlinger P, et alPooled CRISPR screening with single-cell transcriptome readout. Nat Methods. 2017;14(3):297-301. DOI: 10.1038/nmeth.4177.
  22. Savell KE, et alA Neuron-Optimized CRISPR/dCas9 Activation System for Robust and Specific Gene Regulation. eNeuro. 2019;6(1). DOI: 10.1523/ENEURO.0495-18.2019.

How CRISPRa and CRISPRi Work

In contrast to regular CRISPR/Cas9 gene editing, CRISPRa and CRISPRi employ a catalytically inactive form of Cas9 (dCas9). This Cas9 variant possesses point mutations in two amino acid residues, D10A and H840A, that deactivate the RuvC and HNH nuclease domains of Cas9, respectively. [1] Although dCas9 cannot cut DNA, it is still precisely recruited to the target DNA by the guide RNA (gRNA). Synthetic biologists have taken advantage of this property of dCas9 by constructing dCas9-based tools that expand the functionality of the CRISPR/Cas9 system.

dCas9 can be transformed into a transcriptional activator or repressor by fusing or otherwise recruiting the appropriate transcriptional effector domains to the inactive nuclease (Figure 1). Commonly used transcriptional activator domains include VP64, the p65 domain of NF-κB, the Epstein Barr virus R transactivator (Rta), and the activator domain for heat shock factor 1 (HSF1). [2] The primary transcriptional repressor used in combination with dCas9 is the Krüppel associated box (KRAB) domain from KOX1. [3]

In the endogenous context, multiple transcription factors and cofactors work in synchrony to stimulate gene transcription. Indeed, CRISPRa tools that recruit multiple unique transcriptional activators to a promoter outperform those bearing a single transcriptional activator domain or redundant copies of the same effector. [4,5] Targeting multiple sites on the same promoter also increases gene activation with CRISPRa. [5] One of the most effective CRISPRa effectors is the CRISPR Synergistic Activation Mediator (SAM) complex, which recruits three unique transcriptional activator domains to the targeted gene promoter. [4, 5] In this system, one transcriptional activator VP64 (a multimeric form of VP16) is directly fused to dCas9. Protein-binding RNA aptamers engineered into the stem-loop regions of the gRNA recruit the other two transcriptional activator domains. [5] CRISPRi and CRISPRa complexes only need to be expressed alongside an appropriately designed gRNA to induce CRISPRi or CRISPRa in mammalian cells.

Figure 1. CRISPRi and CRISPRa utilize catalytically inactive Cas9 and transcriptional activators and repressors to modulate gene expression.

Considerations for Designing a CRISPRa or CRISPRi Experiment

How to design the gRNA

The design of gRNAs differs between CRISPRa or CRISPRi and CRISPR KO, where efficient gRNAs target early exons in protein-coding genes to prevent the expression of a truncated protein that may retain some function. A screen of all possible gRNAs surrounding the transcriptional start site (TSS) of 49 genes enabled the identification of the optimal targeting windows for both CRISPRi and CRISPRa. [6]

Consistent with its dual mechanism of action, CRISPRi using the dCas9-KRAB repressor was efficient for gRNAs falling in a window spanning from -50 to +300 base pairs (bp) from each TSS, with the best-performing gRNAs targeting the first 100 bp downstream of the TSS. [6] For CRISPRa, the window spanning -400 to -50 bp from an individual TSS was determined to be the optimal targeting region. [6] This window applies to all CRISPRa effectors, including the SAM system. [5]

Since the efficacy of a CRISPRa or CRISPRi gRNA is impacted by the proximity to the TSS of the targeted gene, meaning gRNA design for CRISPRa or CRISPRi is more complicated for poorly annotated genomes. The efficacy of gRNAs for CRISPRa or CRISPRi is reduced by:

Long protospacer lengths (>21 bp).
The presence of nucleotide homopolymers (e.g., AAAA or GGGG) in the protospacer region.
Also, the chromatin environment surrounding the targeted genomic region can limit the nuclease accessing the site. [7]

Identifying highly active gRNAs is vital for constructing genome-scale CRISPRi and CRISPRa libraries. Such libraries include 3-10 gRNAs per gene to ensure that screening hits are not because of inadequate gRNA efficacy. [8, 9] Pooled gRNA screens offer a robust and straightforward method for clarifying how various factors influence gRNA activity, as thousands of gRNAs can be tested with relatively minimal effort. [10]

Pooled gRNA screens also inform gRNA prediction algorithms. Observations, such as the effects of gRNA sequence, position, and accessibility, have enabled the iterative and comprehensive identification of highly active gRNAs. [11, 12] This has led to the development of highly active and compact (i.e., fewer gRNAs per gene) gRNA libraries for CRISPRi and CRISPRa. [9] Ultimately, compact CRISPR libraries reduce the number of cells needed to perform genome-scale screens.

The Sigma-Aldrich® suite of functional genomics solutions includes optimized, whole-genome gRNA libraries for CRISPRi and CRISPRa as well as custom gRNA design services for individual targets and large-scale libraries. Discover a detailed protocol for pooled CRISPRa screening.

CRISPRa and CRISPRi Compared to Competing Technologies

The mechanisms of CRISPRi and CRISPRa differ from other gene perturbation technologies, such as RNA interference (RNAi) and CRISPR KO (Figure 2). These differences offer advantages and challenges that should be taken into consideration when selecting which technology to implement.

Figure 2. Mechanism of CRISPRa and CRISPRi compared to RNAi and CRISPR KO.

CRISPRi vs. RNAi

The mechanism of CRISPRi differs from other gene perturbation technologies, such as RNA interference (RNAi). RNAi inhibits gene expression by utilizing a conserved RNA processing pathway to degrade targeted mRNAs in the cytoplasm. The cytoplasmic location of the endogenous machinery co-opted by RNAi prevents it from efficiently targeting nuclear RNA, such as ncRNA. [13] RNAi can also induce off-target effects by displacing endogenous small RNAs (e.g., microRNAs) from RISC. [14] CRISPRi avoids these unwanted effects because all of the components are from exogenous sources. Finally, CRISPRi outperforms RNAi in large-scale screening applications by generating more robust phenotypes with fewer off-target effects. [6]

CRISPRi vs. CRISPR KO

Although CRISPR gene editing is a powerful method for generating LOF mutants, several disadvantages preclude its use in all LOF studies. The double-strand breaks caused by Cas9 can induce cytotoxicity and genomic instability, particularly in cancer cell lines. [15, 16] Also, roughly one-third of indels will not cause the necessary frameshift to knock out targeted genes. Non-coding regions (e.g., long non-coding RNAs) can be difficult to target by Cas9 because they require edits at two sites to create a sufficiently large mutation to generate LOF. [17] CRISPR KO is also a suboptimal solution for investigating the effects of genes that are essential for cell survival beyond their identification in genome-wide screens as cells can tolerate a partial knockdown, but not a complete knockout, of such genes. [10] By not cutting DNA, CRISPRi circumvents the disadvantages of CRISPR KO, making it a superior choice for perturbation of non-coding genes or applications that call for a reversible or titratable solution.

CRISPRa vs. ORF Overexpression

CRISPRa offers a few advantages over existing gain-of-function (GOF) techniques such as open reading frame (ORF) overexpression. Overexpression of ORFs commonly utilizes strong viral promoters (e.g., CMV) that result in supraphysiological expression levels. Because CRISPRa is targeted to endogenous gene promoters, supraphysiological transcription is challenging to achieve, making CRISPRa better suited to applications that favor the physiological or near-physiological expression of targeted genes. [18] This also means CRISPRa is more likely to upregulate the most relevant splice variants of the targeted gene, particularly in cases when they are unknown. [10] Finally, genome-scale ORF libraries are more difficult to synthesize than equally-scaled CRISPRa libraries.

CRISPRi and CRISPRa add to the existing suite of genome engineering technologies by offering complementary insights into complex biological processes. Unlike CRISPR KO, which provides binary and permanent outcomes, CRISPRa and CRISPRi can be used to reversibly titrate gene expression levels within a broad, dynamic range (up to and exceeding 1,000-fold). [2] Also, large-scale LOF and GOF screens can identify unique, yet functionally related, hits under otherwise identical screening parameters. The identification of SPI1 (by CRISPRa) and GATA1 (by CRISPRi) as regulators of cell growth in the K562 human myeloid leukemia cell line highlights the usefulness of this parallel use of CRISPRi and CRISPRa. [6] Both manipulations increased cell growth in K562 cells, confirming SPI1’s known inhibitory effects on GATA1 activity. [19] Therefore, while individual CRISPR screens are independently powerful tools, when used in combination, CRISPRi, CRISPRa, and traditional CRISPR KO screens offer robust validation and strengthen findings, as well as provide a more detailed understanding of gene pathways.

How to Perform a CRISPRa or CRISPRi Experiment

A typical CRISPRa or CRISPRi experiment involves three necessary steps:

Ideally, the generation of a stable cell line that expresses the modified Cas9 with the appropriate CRISPRa or CRISPRi constructs.
Delivery of the gRNA.
Analysis of the results.
Below is a brief overview of these steps; a more thorough protocol is available here.

Generation of a Helper Cell Line

Transient transfection of all components is sufficient for cell lines that are efficiently transfected (e.g., HEK293 cells), while lentiviral transduction provides more consistent and robust results across a variety of cell lines. For large-scale screening applications, creating a stable “helper” cell line that expresses dCas9-KRAB or the CRISPR SAM complex at the outset permits rapid validation at the end of the screening process. Sigma-Aldrich® lentiviral vectors are available for helper cell line generation that are optimized to improve functional viral titers.

gRNA Delivery

Lentiviral transduction of gRNA followed by antibiotic selection ensures consistent and robust activation or repression for both small and large-scale applications. Lentiviral delivery is essential for pooled CRISPR screens because genomically-integrated gRNA sequences serve as barcodes for later deconvolution. As such, pooled CRISPR libraries should be delivered at a low (<0.7) multiplicity of infection to ensure each cell receives only a single CRISPR copy. [8]

Analysis

For small-scale applications, analysis involves measuring changes in mRNA and protein levels using quantitative polymerase chain reaction (qPCR) and western blotting, respectively, as well as the functional consequences of those changes. Pooled CRISPR screens use next-generation sequencing to analyze changes in the representation of lentivirally transduced gRNAs following a selection process.

Applications of CRISPRa and CRISPRi

CRISPRa and CRISPRi are particularly amenable to genome- and subgenome-scale screening applications, including identifying drug targets [20] and cellular factors that mediate drug resistance, [5] due to the relative ease with which gRNA libraries can be synthesized, cloned, and packaged in lentivirus. [6, 5] Arrayed screening is also possible with CRISPRa and CRISPRi. Two SigmaAldrich® webinars provide more insight into CRISPR screening including the benefits of a whole-genome gain-of-function screening and the differences between CRISPRa, CRISPRi and CRISPR KO screens.

Although pooled CRISPR screening has many advantages over arrayed screening, it is typically limited to studying crude phenotypes such as cell growth and viability. By contrast, virtually any type of analysis can be done in an arrayed screen because CRISPR perturbations occur in individual wells of microtiter plates. The advent of single-cell RNA sequencing, however, provided a high-content transcriptomic analysis that could be integrated into pooled CRISPR screen workflows. This is because each CRISPR perturbation, including its transcriptomic and phenotypic effects, is confined to an individual cell. [21] Thus, as long as individual cells can be separated, CRISPR perturbations can be linked to a transcriptomic readout as well as a phenotypic outcome. CRISPR single-cell screening in partnership with 10x Genomics is now available from the Sigma-Aldrich® portfolio.

CRISPRa can be used to study non-coding genes [6] or individual transcript variants of a gene, [22] although well-annotated genomes are crucial for these applications. CRISPRi is also able to distinguish between different transcript variants, unlike CRISPR KO and RNAi, as long as the TSS for each variant is mapped.

CRISPRa and CRISPRi Tools Summarized

CRISPRa and CRISPRi are potent tools for modulating gene expression in a reversible and titratable manner. These technologies use dCas9 to act as synthetic transcription factors by recruiting endogenous transcription activator and repressor complexes to gene promoters and enhancers, resulting in up- or downregulated gene transcription. CRISPRi achieves LOF phenotypes without the limitations of RNAi and CRISPR KO, and CRISPRa provides a scalable solution for large-scale overexpression screens. Although CRISPRa and CRISPRi usually rely on delivery by lentivirus, these technologies offer new possibilities for genome engineering. CRISPRi and CRISPRa can be used individually to target areas of the genome that are inaccessible by other gene perturbation technologies (e.g., non-coding regions) or in conjunction to uncover gene-regulatory networks underlying discrete phenotypes. Finally, pooled CRISPRi and CRISPRa screening can be paired with single-cell RNA-seq to enable high-dimensional characterization of CRISPR perturbations.

磁珠纯化核酸文库的方法

Bead buffer

Dissolve 20 g of PEG 8000 with 48.75 ml of nuclease-free water. Add 1 ml of 1 M Tris-HCl, 0.2 ml of 0.5 M EDTA, 50 ml of 5 M NaCl and 50 µl of Tween 20 pH 8.0. Final concentrations in the solution are 20% (wt/vol) PEG 8000, 10 mM Tris-HCL, 1 mM EDTA, 2.5 M NaCl and 0.05% (vol/vol) Tween 20. Store at room temperature for ≤1 year.

Diluted AMPure XP beads

To make a 1:8 bead dilution, add 700 µl of bead buffer to a tube and add 100 µl of AMPure XP beads. Resuspend and vortex until homogenous. Store at 4 °C until indicated expiration date of AMPure XP beads.

Ethanol (80%, vol/vol)

Measure volumes by pipette and not by ‘adding up’ ethanol to 10 ml.

Add 2 ml of nuclease-free water to a 15-ml tube and add 8 ml of 100% (vol/vol, absolute) ethanol. Store at room temperature for ≤1 d. Make fresh for each bead purification.

  • Depending on the number of pools, bead purifications can be a bottleneck. We therefore do not recommend cleaning more than eight reactions simultaneously.
  • In the following steps, bead cleanups are needed to remove byproducts of the previous reactions and for size selection. For pool volumes >30 μl, we recommend using AMPure XP beads that have been diluted with bead binding buffer (‘Reagent setup’). By doing so, the volume of AMPure XP beads is reduced while the size selection is not affected. This enables proper elution of the AMPure XP beads in the small volume of 6 μl in Step 91. Taking the example of a 448-μl pool volume mentioned above, we recommend using a bead dilution of 1:8, meaning 1 part AMPure XP beads and 7 parts bead binding buffer (‘Reagent setup’). For smaller pool volumes, we recommend smaller bead dilutions. Keep ~30 μl of AMPure XP beads in the final mix, to enable the water elution in Step 91.

Procedure:

83 Equilibrate diluted AMPure XP beads to room temperature for 30 min. Vortex until the bead-buffer mix is homogenous.

84 Add 0.8 volumes of diluted AMPure XP beads to 1 volume of pool (Step 82). Allow material to bind to the AMPure XP beads for 10 min at room temperature. Following Steps 84–95 need to be carried out at room temperature.

85 Put the tube on a magnetic rack and allow the AMPure XP beads to accumulate. Keep samples on the magnetic rack until Step 90.

86 Remove the aqueous phase carefully without disturbing the AMPure XP beads.

87 Add 500 µl of fresh 80% (vol/vol) ethanol and leave for 30 s.

88 Remove the ethanol carefully without disturbing the AMPure XP beads.

89 Repeat Steps 87 and 88. Pulse-spin the tube and place it in a magnetic rack to remove excess ethanol.

90 Let the AMPure XP beads air-dry for 5 min or until they appear ‘matte’.
CRITICAL STEP: Do not let the AMPure XP beads overdry. Elute in water before cracks start appearing in the bead pellet.

91 Add 6 µl of nuclease-free water to the AMPure XP beads to elute the material and resuspend until the beads and water form a homogenous mix. Place the tube on ice.

via: https://www.ncbi.nlm.nih.gov/pubmed/32350457

基于抗体的抗病毒策略利弊

新型冠状病毒感染导致6万多人出现感染性肺炎,上千的病人丧失生命。无论是政府部门、科研团队还是普通民众,大家都在期盼抗体药物的出现,而从SARS期间直接收集痊愈患者的血清治疗重症患者的实践,直接折射出抗体对于治疗此类感染疾病的重要性。诚然,抗体是机体对抗病毒感染最重要的武器之一,针对病毒的中和性抗体(英文名称neutralizing antibody)一旦产生,不但量大而且持久,从而高度有效地阻断病毒进入细胞内,而病毒不能进入细胞,就不能繁殖、扩增,细胞外的病毒就会逐渐自身分解,抗体神奇之处也就在于此。如果将灭活的病毒颗粒直接注射体内,引发机体产生针对病毒的抗体,这便是传统的疫苗,产生预防接种的效果,当前新冠病毒的疫苗研发,也是遵循这一基本原理。然而,只要机体产生出抗体,就能控制住病毒,这种想法可能仅仅是一种错觉,真实情况远非如此,有些抗体甚至可以促进新冠肺炎发展。那么,这是危言耸听,还是具有科学道理?一个事实是,许多新冠肺炎重症患者体内先前抗体已产生,为什么这些抗体不能控制住病毒?这是由于抗体的复杂性所导致。

相同病毒与多种抗体生成
机体有20种氨基酸,化学共价键将一个一个的氨基酸连接在一起,形成长链,这就是通常所说的蛋白质。抗体是一种蛋白质分子,呈现树杈样Y字型结构,树杈部分识别、结合抗原(通常是异己的蛋白质)。自然界存在各种各样的异己蛋白质,抗体要识别它们,其树杈部分也相应是各种各样的(生物学上称树杈部分为抗体的可变区),乃至形成各种各样的抗体,但这些不同的抗体的树干部分基本是相同的(生物学上称之为抗体的恒定区)。新型冠状病毒的核酸物质RNA位于核心,被核衣壳蛋白包裹,再外面是一层包膜,包膜上有spike蛋白(放大后形状类似钉子)、envelope蛋白即包膜蛋白、membrane蛋白即膜蛋白。除了这些维持病毒结构的蛋白质外,病毒的核酸遗传物质还可以指导不参与病毒结构的其它病毒蛋白的生成(这些病毒蛋白质存在于被感染的细胞中,不存在于病毒颗粒中)。所有这些病毒蛋白质都是异己的蛋白质,对于任何一种异己的蛋白质,机体都有可能产生专门针对它的抗体。因此,新型冠状病毒感染人群,个体体内可以产生多种不同的针对病毒的抗体。

大部分抗体缺乏抗病毒效应
既然机体产生了针对病毒的多种抗体,那么每种抗体是否都发挥抗病毒的保护作用?答案是否定的。抗体要发挥抗病毒的作用,前提条件是抗体要识别并结合病毒颗粒。但是,非结构的病毒蛋白不存在于病毒颗粒中(存在于被感染的细胞内),因此,针对这一大类病毒蛋白质的抗体,其实是没有抗病毒作用的。那么,抗体针对存在病毒颗粒中的蛋白质(所谓针对,通俗讲就是一个萝卜一个坑,这种抗体特异性地结合这种蛋白质),是否就有抗病毒作用?答案是,只有针对病毒表面蛋白质的抗体才可能产生抗病毒的效果。新型冠状病毒表面是一层包膜,针对包膜里面的病毒蛋白质,抗体无法接触到,因此,这部分抗体也不具有抗病毒的效应。总之,病毒颗粒感染机体后,体内可产生针对病毒蛋白质的多种不同的抗体,但大多数抗体其实没有抗病毒的作用,只有识别病毒颗粒表面蛋白质的抗体,才可能有抗病毒作用。
有效抗体抗病毒的作用方式

images?token=eebe697202de502b3923e7019f9

ACE2抗体的阻断模式图。图片引自:https://www.rndsystems.com
识别病毒颗粒表面蛋白质的抗体,能够产生抗病毒作用,那么这些抗体发挥作用的途径又是如何?冠状病毒颗粒致病是通过病毒颗粒表面spike蛋白(钉子蛋白)与肺部上皮细胞表面的一种称为血管紧张素转化酶2(angiotensin-converting enzyme 2,ACE2)的蛋白质结合,ACE2随后发生形状结构的变化,导致病毒进入细胞内,并利用细胞自身的氨基酸分子、核苷酸分子以及脂类分子,通过化学反应合成新的病毒颗粒,这些新的病毒颗粒释放到细胞外,利用同样的方式,感染周围正常的细胞。针对spike蛋白的抗体,结合病毒颗粒表面的spike蛋白,阻断spike蛋白与ACE2的结合,这也就阻断了病毒进入细胞。这种针对spike蛋白的抗体,就是所谓的中和性抗体。中和性抗体通过阻止病毒入侵细胞,而发挥保护作用,是抗体发挥抗病毒效应的主要力量。冠状病毒表面还有包膜蛋白以及膜蛋白,但是这两种蛋白质可能并不介导病毒进入细胞,因此,抗体与包膜蛋白或者膜蛋白结合,可能不影响病毒进入细胞,但是如果这种结合影响到spike蛋白的构象(三维空间结构),使得spike蛋白与ACE2不能很好结合,则可以妨碍病毒进入细胞(这种情况的可能性偏低)。针对包膜蛋白或者膜蛋白的抗体,其与病毒表面的相应蛋白结合后,即便不影响spike蛋白介导病毒进入肺上皮细胞,但是却可以介导机体免疫细胞对病毒颗粒的吞噬。这是由于吞噬细胞表面有特定的蛋白质(称为Fc受体),能够识别抗体的树干部分,即恒定区。这样抗体,通过其可变区与病毒结合,通过其恒定区与吞噬细胞结合,从而大大促进了吞噬细胞对病毒颗粒的吞噬,而被吞噬的病毒在吞噬细胞内被分解清除。综上,抗体发挥作用的途径分为两类:中和性表面抗体与病毒结合阻止病毒进入细胞(御敌于国门外);非中和性表面抗体与病毒结合,介导免疫细胞吞噬、清除病毒(杀敌于国门内)。

抗体抗病毒不利的方面
非中和性表面抗体与病毒结合,介导免疫细胞吞噬,这种免疫细胞主要就是巨噬细胞(人体内专职的吞噬细胞)。巨噬细胞将病毒吞入后,病毒颗粒被包裹在一种称为内吞体的囊泡里面,随后内吞体离开细胞表面向细胞中心移动,在此过程中与一种称为溶酶体的囊泡融合,而溶酶体内含有各种各样的水解酶,能够水解病毒,从而消灭了病毒。但在免疫系统进化出这样一种抗病毒的机制的同时,病毒也在进化,在利用一切手段逃过吞噬杀伤。其中一种机制是,在内吞体与溶酶体融合之前,病毒就逃离内吞体。如何逃离呢?内吞体包裹病毒后,内吞体囊腔内液体逐渐酸化(pH值降低),病毒可以借助酸化而脱去最外层的包膜,裸露出病毒核酸,并顺势将病毒核酸从内吞体中转运至细胞浆中,在细胞浆中病毒核酸可以进行复制,形成新的病毒颗粒并被释放至细胞外。这样,病毒借助表面抗体,将免疫细胞转变为病毒的中间体,以逃逸免疫杀伤。
病毒在巨噬细胞的胞内扩增可能还不是最糟糕的事情,更坏的是,病毒有可能通过巨噬细胞,促进炎症风暴。新型冠状病毒对肺部细胞的损伤,一般不会直接导致病人的死亡,导致病人死亡的主要原因是非特异性的免疫细胞过度激活,释放出大量促炎因子,典型如白细胞介素-1、白细胞介素-6、肿瘤坏死因子等,形成所谓的细胞因子风暴,学名为细胞因子释放综合征(cytokine release syndrome, CRS)。CRS的病理损伤主要表现在毛细血管。毛细血管管壁是由单层血管内皮细胞排列而成,内皮细胞之间缝隙小的仅1-2纳米,大的也只是5-8纳米,这是由于内皮细胞与内皮细胞相接壤部分,其表面均有众多的连接蛋白,彼此紧密连接,从而导致如此小的缝隙。但是上述的促炎因子作用于肺组织的毛细血管内皮细胞,使得内皮细胞表面不再表达或者大大降低连接蛋白的数量,这样内皮细胞间的缝隙,一下子变得非常大,毛细血管内的血液就从增大的缝隙间流出,填充肺泡,这就是炎症风暴。那么,引发炎症风暴的细胞因子究竟是由什么样的免疫细胞所释放?巨噬细胞是罪魁祸首。巨噬细胞是机体重要的一线防御细胞,数量众多。病毒感染巨噬细胞,能够迅速激活巨噬细胞,诱导巨噬细胞释放促炎因子,但当病毒在巨噬细胞内大量繁殖时,巨噬细胞的激活就格外强烈,能够释放超量的促炎因子,引发细胞因子风暴。

非中和性表面抗体的效果取决于时相
既然病毒在巨噬细胞中繁殖,存在给机体带来巨大危害的风险,那么非中和表面抗体是不是完全不好呢?答案也不是,取决于时相。在病毒感染的早期阶段,巨噬细胞各方面功能完好,吞噬抗体介导的病毒,更多的是在溶酶体中将其水解,即便有部分病毒逃逸至胞浆,巨噬细胞启动的干扰素信号通路,也能够有效抑制病毒的复制和扩增。在病毒感染的中后期,巨噬细胞不仅感受病毒的信号,而且感受各种细胞因子的信号,巨噬细胞的功能出现变化,病毒则利用可乘之机,一方面逃逸至胞浆,一方面大量扩增,而大量扩增的病毒数量,反过来迫使巨噬细胞被强烈激活,进而释放超量的促炎因子,造成对肺组织的损伤。因此,针对病毒表面蛋白,中和抗体总是通过阻止病毒进入肺上皮细胞,而发挥保护作用,但是非中和抗体主要是介导病毒进入巨噬细胞,在早期阶段发挥抗病毒作用,但在中后期可能主要是导致肺部免疫损伤。

机体清除病毒最终依靠T细胞
中和抗体是御病毒于细胞之外,但对于已进入细胞内的病毒是无能为力的,同时,中和抗体也只能是大部分阻止病毒入侵细胞,仍会有小部分或者一部分病毒进入细胞内。对于躲藏在细胞内的病毒,其最终的杀灭依赖于人体内的T细胞。病毒在肺上皮细胞内,会将病毒蛋白的信息表达在被感染的细胞表面,而T细胞则能够识别被感染细胞表面的病毒蛋白信息,从而对被感染的细胞发动攻击,并将其杀灭,其结局是被感染的细胞死亡,躲藏在其内的病毒也遭受被降解的命运。因此,即便是中和抗体,其也不是万能的,但它却能很好地扫除障碍,让T细胞发挥最后的临门一脚。

总之,对于新冠肺炎,太多希望寄托于抗体,但抗体并非一般理解的那样简单,即机体只要有了抗体就能够将病毒清除。对于抗体的复杂性,甚至对疾病加重的一面,我们需要有足够的认识。同时,这对于疫苗研发也有重要的指导意义,因为接种疫苗目的是让机体产生抗体,其实是要产生针对病毒颗粒表面蛋白的中和抗体。将疫苗接种机体,产生抗体很容易,但是要产生这种保护性中和抗体却很不容易,这给疫苗研发带来巨大挑战,我们应持谨慎的态度,开展深入细致的工作。

8种基因克隆的方法

Gene cloning is one of the most important steps in recombinant DNA Technology. Now-a- days researchers are using different cloning techniques depending on purpose, time, cost, ease of use and availability of resources.  A few of the techniques are briefly explained below.

1.   USING RESTRICTION ENZYMES:

This is the traditional cloning technique where a gene of interest is inserted in to a vector by a cut and paste method. Restriction digestion of both gene of interest and vector was performed by using restriction enzymes that cut the gene at a specific sequence. Several enzymes like EcoR I, BamH I, Nco I, Nde I, Xho I etc.,are used. Digestion with some of these enzymes result in a sticky end and some in blunt ends. After the digested fragments are cleaned up, the digested gene and vector are ligated to form a recombinant plasmid using DNA ligase enzyme. There are so many standardized protocols for this technique, but in some cases optimization of buffer is required and time of restriction digestion also plays a major role. When using two restriction enzymes (double digestion) buffer used should be compatible for both the enzymes. If there is no compatible buffer, gene and vector should be first digested with one enzyme followed by the other.

2.   TA CLONING OR TA/TOPO CLONING:

TA cloning is an easy, rapid cloning technique that consumes less time compared to traditional cloning method. Here a single enzyme is used for both digestion and ligation called Topoisomerase I that digest DNA at specific site 5’-(C/T)CCTT-3’ and ligates at 3’ phosphate group of thymidine base. This can be performed within 5 to 10 minutes.

Polymerase enzyme used is also very important in this technique, like Taq DNA polymerase. Taq enzyme add poly A tail to the PCR product which is complementary to the thymidine residues and thus can easily be ligated.

3.   GATEWAY CLONING

Gateway cloning is a molecular cloning technique developed in the 1990s and gained wide importance in life science research. In this method, specific primers are used to insert specific gene sequences on both sides of the desired gene by PCR. Gateway cloning is a two step process, where two enzyme mixes, BP clonase and LR clonase, are used. The gene of interest flanked with specific sites attB is first cloned into an entry vector with specific attP sites flanking on both sides by using BP Clonase resulting in attL sites. Later this entry clone is used to transfer the gene into expression vector flanked by attR site using LR Clonase. This technique can be used to clone genes into multiple vectors ranging from bacterial or insect or mammalian expression systems. It can also be used to clone multiple genes into a specific vector like CMV promoter.

4.   INFUSION CLONING

Infusion cloning is a simple one step cloning technique where the gene of interest is annealed into a vector based on complementary flanking sequences. In this method, the gene of interest was amplified by PCR and gene sequences of 15 nt length was amplified on both sides of the gene complementary to that of linearised vector. Then with the help of infusion enzyme the gene can easily be cloned into the vector. In this procedure any vector of any size can be used to clone the gene of interest.

5.   LIGATION INDEPENDENT CLONING

Ligation independent cloning is cost effective simple cloning technique. The gene was amplified with specific gene sequences of 12 nt length complementary to modified LIC vectors. These vectors have to be linearized by PCR or by restriction digestion. Both enzyme and vector were then incubated with T4 DNA polymerase. This polymerase has 3’ to 5’ exonuclease activity resulting in overhangs that are complementary to both gene and vector. Later dCTP was added to get back its polymerase activity. The resulting clone will have nicks which are later repaired by E.coli cells.

6.   BI- or MULTI-CISTRONIC CLONING

Cloning two or more genes can be possible by using this technique. Here the genes to be expressed are separated by a specific sequence. Currently two strategies are used for expressing two or more genes.

  1. Internal ribosome entry site (IRES) elements – In eukaryotes translation occurs only from 5’end hence only one translation end. But this IRES elements have the capability to start translation irrespective of 5’end. So, if this IRES elements are incorporated between two genes both can easily be expressed. But this method has few disadvantages like their large size (500bp), often the second gene express less compared to the first
  2. 2A peptides – Small peptides of 20 aa length are used by researchers to overcome some of the problems faced by using IRES. 2A peptide sequences usually start with GSG residues and end with PGP, where the cleavage of the second protein occurs between G and P and the second one will start with proline residue. This technique is successfully used to clone more than two genes in a single multi-cistronic

7.   GIBSON ASSEMBLY

Gibson assembly is a cloning technique where multiple DNA fragments can be joined in a single isothermal reaction (constant temperature of 50 ℃). In this method, three enzymes are used. An exonuclease, that cleaves the 5’ end of DNA fragments allowing them to anneal with the other DNA fragment. A polymerase to fill the gaps after the two genes anneal. Finally, a Ligase to join the two fragments removing the nicks. In a single tube up to 5 DNA fragments can be assembled using this technique. But to join large number of fragments (up to 15 fragments), the reaction can be performed in two tubes. In the first step exonuclease and annealing steps are done and in the next step polymerase and ligase enzymes will complete the assembly.

8.   GOLDEN GATE CLONING

 Golden gate cloning is a seamless cloning method in which multiple DNA fragments are joined together without any nicks. Two enzymes are used in this cloning method, Type II restriction enzymes and DNA ligase enzyme. Type II restriction enzymes like Bsa I, BsmB I, Bbs I. These enzymes will cut the DNA fragment outside the recognition sequence resulting in non palindromic over hangs. The reaction is carried out at 37 ℃ and 16 ℃ for restriction digestion and ligation respectively. This is an irreversible method of gene assembly, once the gene is inserted in the vector it can never be cut with the same restriction enzyme. This method is carried out in two steps, first single gene construct is made with a promoter, ORF and terminator. In the second step, several single gene constructs are joined to get multigene constructs. For the second step, modular cloning system (MoClo) and Golden braid 2.0 can be used.


References:

  1. Thieme F, Engler C, Kandzia R, Marillonnet S. Quick and Clean Cloning: A Ligation- Independent Cloning Strategy for Selective Cloning of Specific PCR Products from Non-Specific Mixes. Agarwal S, ed. PLoS ONE. 2011;6(6):e20556. doi:10.1371/ journal.pone.0020556.

RT-PCR检测SARS-Cov-2中的假阴性

王辰院长表示:“核酸检测对于阳性病人,最高有30~50%的阳性率,“ 也就是说,有些患者核酸检测结果为阴性,却在临床上被确认为疑似COVID-19,属于“假阴性”,一些人因此质疑这项检测无法发挥作用。但事实并非如此,核酸检测仍是当前最准确和灵敏的SARS-CoV-2检测方法。阴性检测结果可能意味着一个人没有被感染;但是,这也可能意味着感染尚未发展到足以被检测到的程度。

“漏检”情况使一些临床医生和民众对检测试剂盒的质量提出了疑问。那么,有可能导致目前核酸检测“假阴性率”高的因素是什么呢?

一般而言,对临床检测的评价有2个重要的指标:特异性和灵敏度。通俗地说,特异性反映了检测时的假阳性率(将非此病患者误诊为患此病的概率),特异性越高则误诊率越低;灵敏度则反应了检测的假阴性率(将此病患者漏诊为未患此病的概率),灵敏度越高则漏诊率越低。目前SARS-COV-2核酸检测的具体假阴性率和假阳性率未见文章统计报道,存在假阴性的问题与多方原因有关:

01 对SARS-CoV-2特点及病程的掌握

自疫情暴发以来,我们对于病毒的认知在逐步增加。到目前为止的研究成果主要是针对病毒的流行病学、病毒序列分析及潜在治疗药物筛查等,而对于病毒病程的研究还没有相关的确切结果公布。在感染病毒后,体液中病毒的含量、分布与症状严重程度是否呈线性正相关尚不明确。如果在临床上有症状,而病毒在肺部还没快速复制释放,此时进行采样,就有可能无法采集到足够的病毒进行确诊。尤其病人在发病的早期阶段可能没有咳嗽,上呼吸道、包括鼻咽部的病毒量很少,显示结果很可能是阴性,出现检测不出的情况。但这样病人的传染性也小,因为上呼吸道没有检测到,提示它传染性不强。

02 采样及样本结果解读

由于可操作性的限制,目前比较常见的采样方法是使用鼻咽拭子、痰液或肺泡灌洗液采集,最常用的方法为采集鼻咽拭子。鼻咽拭子采集这种方法有先天的局限性,其随机性较高;其次试剂盒要求病毒灭活,而SARS-CoV-2为RNA病毒,其稳定性也比较低。而在采样后 ,需要从样本中提取病毒核酸,提取过程的效率一定程度上会受个体差异、采样操作及检测操作者的规范程度影响。

总的来说,在临床检测中,采样→保存送样→病毒灭活→裂解核酸提取→检测,是一个连贯的受控过程,其中任何一个环节出现问题,就有可能无法提取出足够、有效的病毒核酸,导致后续检测无论使用的是何种方法,都会出现假阴性的情况。建议有条件的医疗机构,一般病人筛查以深部痰液标本为佳,重症气管插管病人以肺泡灌洗液为准。

此外,在检测结果解读时,有些试剂说明书上描述需2个靶标同时阳性才可报阳性,将一个靶标阳性报为阴性是否也是导致假阴性的原因之一,值得探讨。同时,对检测反应曲线的观察也需有经验的操作人员才能给出正确的结果。
03 检测试剂盒的设计与验证

1 月 26 日晚间,国家食品药品监督管理局启动应急审批程序,仅 4 天就批准了四家公司四个试剂盒产品,用于紧急应对此次武汉COVID-19疫情。据报道,目前国家药监局已批准了7个新型冠状病毒试剂盒。

一般而言,检测试剂盒作为三类医疗器械,需要经过临床试验,在特异性、灵敏度等多项指标达到要求后,才可由国家食药监局批准上市进入临床,这通常需要花费数月甚至数年的时间。此次疫情暴发突然,在试剂盒的开发中拿不到也来不及用足够的临床样本进行验证,而临床应用的需求迫在眉睫,因此此次仓促上阵的核酸检测试剂盒质量可能参差不齐,核酸检测稳定可靠性尚存疑。

目前等待核酸检测的人数大大超过检测能力,在试剂盒上市后,厂家也应将试剂盒性能确认的各项指标继续完成。在病患诊治压力较小的地区,有能力、有条件的检测机构也应该对检测试剂盒进行全面的性能验证,包括技术重复、人员重复、仪器重复、检测下限(能检出的最低病毒核酸含量)确认等。由于采样器械、实验耗材、检测仪器不同,都可能影响试剂盒的性能,因此有必要确定本地实验室能否实现试剂盒说明书中的性能指标,这在提高检测阳性率方面也是必不可少的一步。

除了PCR这种技术手段,目前基于二代测序(NGS)等技术平台的检测试剂也在陆续开发中,届时可对多种检测方法和试剂盒进行交叉验证。

04 小结

综合上述种种因素,目前核酸检测的灵敏度可能偏低或不稳定,造成假阴性率的可能性升高。

武汉大学中南医院影像科副主任张笑春教授疾呼将CT影像学检查结果纳入确认诊断标准,在目前情况下很有意义。但CT影像学检测的灵敏度高而特异性却可能较低,仅用CT检测假阴性可能小但是可能造成大量假阳性,从而可能增加不必要的医疗负担和假阳性患者交叉感染的概率。

毋庸置疑的是,核酸检测最终一定是COVID-19无创诊断的金标准,但鉴于目前武汉及其周边地区的急迫形势,需要优先考虑集中收治所有可能造成疫情传播的疑似患者,因此应将核酸检测与CT影像相结合,将CT检测作为排查疑似患者的主要标准,及时对所有疑似患者进行收治。与此同时,我们应该进行重复的核酸检测,并结合临床症状以保证诊断的准确性。美国FDA也提示,核酸检测阴性结果并不能够排除SARS-CoV-2感染,而且这些检测结果不应作为治疗或患者管理决策的唯一依据。阴性结果还必须与临床观察、患者病史和流行病学信息一起进行评估。根据最新报道,这种核酸检测结合CT的诊断方式已得到我国临床专家的支持。

AAV滴度测定新方法:Droplet Digital PCR

AAV titering using quantitative PCR

Before we dive into the details of ddPCR, we should first note that quantitative PCR (qPCR) has been a powerful tool for quantifying AAV for some time now. When titrating AAV by qPCR, viral DNA is amplified and monitored in real time. When the PCR is complete, the results are analyzed by comparing the threshold fluorescence of the viral DNA to the threshold fluorescence of a standard – a set of reactions with known quantities of DNA. Additionally, an AAV reference, a virus with a known titer, can be used to confirm that the standard curve is giving an accurate readout of your samples.

Of course, if qPCR were perfect there would be no need for ddPCR. One issue with qPCR is that the results can vary by a factor of 2. This means that if you set up two identical assays with the same sample, you could end up with a titer of 4 x 10¹² genome copies/mL or 8 x 10¹² genome copies/mL and both results would be valid. This is why the AAV reference is critical. It allows you to determine if your titers are within the expected range.

Xnip2020-01-16_16-17-52.png
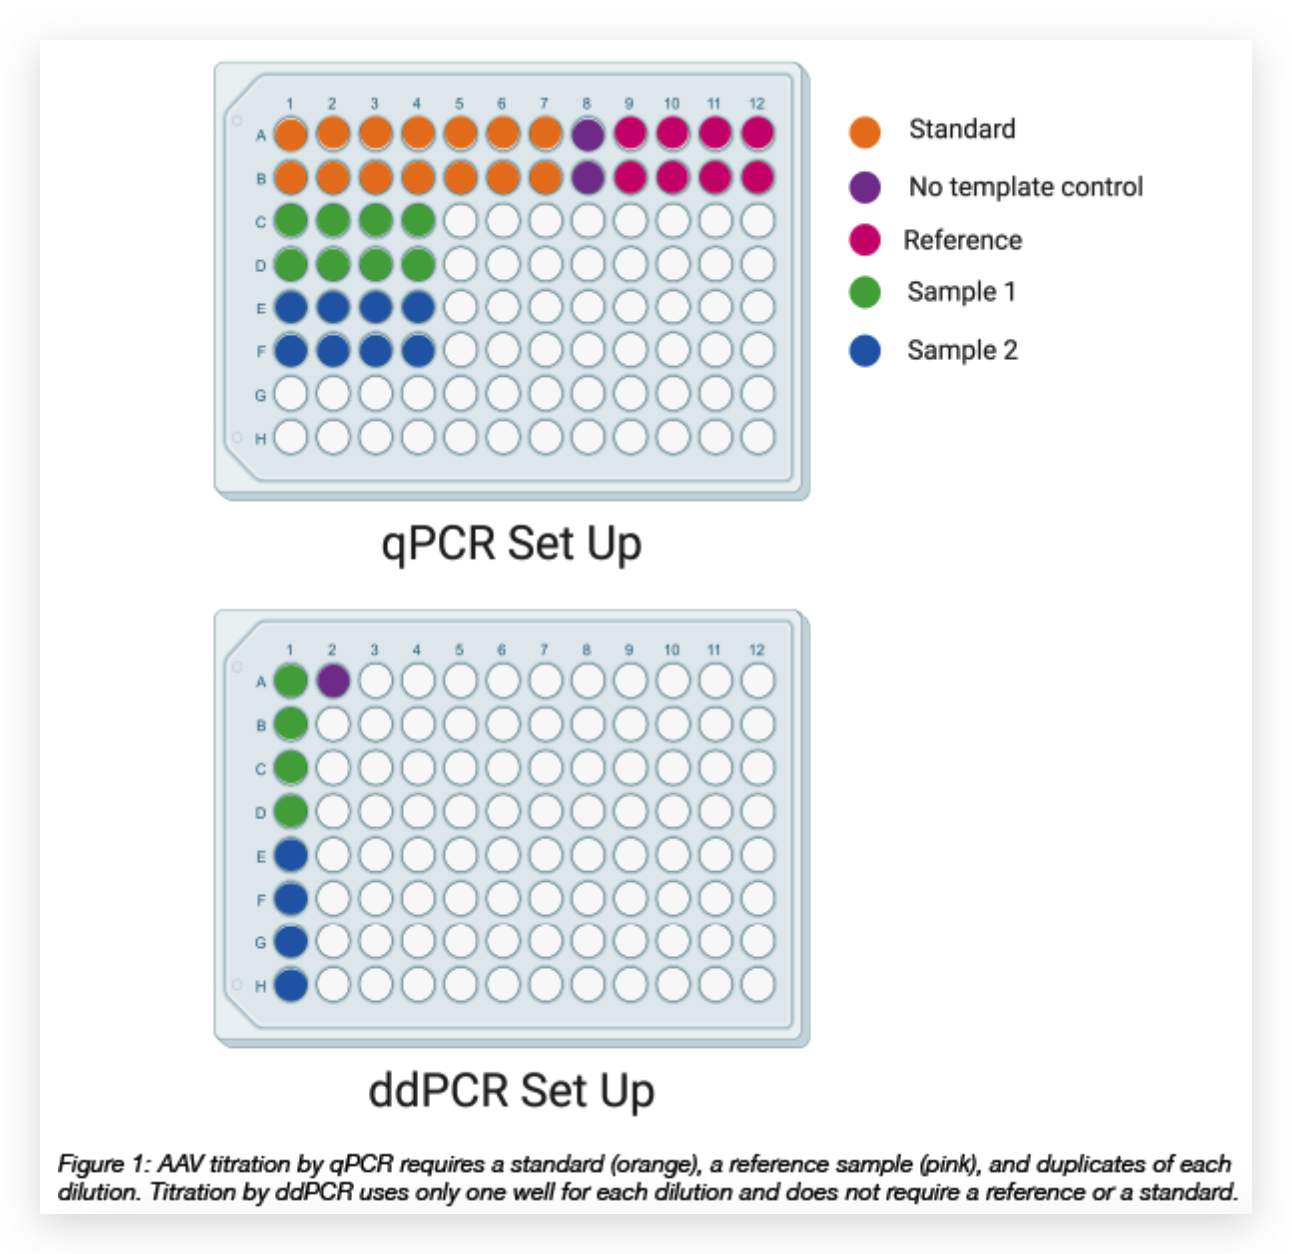
We have also found that generating the standard curve for qPCR can be challenging to get right. We use a linearized plasmid standard. However, even when the standard is made properly, it is unstable and may only work for a small number of qPCR runs before a new one is needed. For these reasons, we are in the process of transitioning our titering method from qPCR to ddPCR.

Droplet digital PCR (ddPCR) does not require a standard or a reference, meaning saving on reagents (and time)!

AAV titering using droplet digital PCR

Droplet digital PCR involves partitioning a PCR reaction mixture into approximately 20,000 droplets using water-oil emulsion technology. Each droplet contains the ingredients for amplification of the target DNA. This partitioning reduces the number of PCR inhibitors per reaction and allows for enhanced detection of the product. As an added benefit, replicates are built into the technology. One well (containing thousands of droplets) can be sufficient to capture the information needed for your PCR experiment.

The process to titrate AAV by ddPCR begins with diluting the virus. It is important to note that the dynamic range of the ddPCR is between 1 and 100,000 genome copies (GC) per reaction. Since AAV titers tend to be in the range of 1012 to 1013 GC/mL, you must serially dilute your virus before adding your sample to a mastermix. We typically load 3 dilutions onto our ddPCR plate. As the titer is unknown, each dilution should fall within the range of the assay for a wide range of titers. We usually dilute our samples 1:6 million to 1:25 million.

After making the dilutions, they are transferred to a new plate containing the mastermix which includes primers and a ddPCR supermix. Note that the supermix and droplet oil that you use should come from the same manufacturer. Otherwise you will end up with poor droplet quality.

Using a droplet generator, the sample and the droplet generation oil are moved through small channels to create a water-in-oil emulsion containing approximately 20,000 droplets. Each droplet contains the material required for a mini amplification reaction to take place.

When the PCR is complete, a droplet reader extracts the droplets from the plate and measures the fluorescence amplitude of each one. Droplets that fluoresce contain the amplified target sequence. After all of the droplets have been read, the software outputs an image of the fluorescence amplitude measured for each droplet in each well (Figure 2). A clean ddPCR should have a clear separation between positive (blue) and negative (gray) droplets. The no template control wells should have very few positive droplets. In the image to the right, there is approximately 1 positive copy per microliter in the no template control wells. You’ll also notice a reduction in the number of positive droplets as the dilutions increase.

Xnip2020-01-16_16-19-21.png
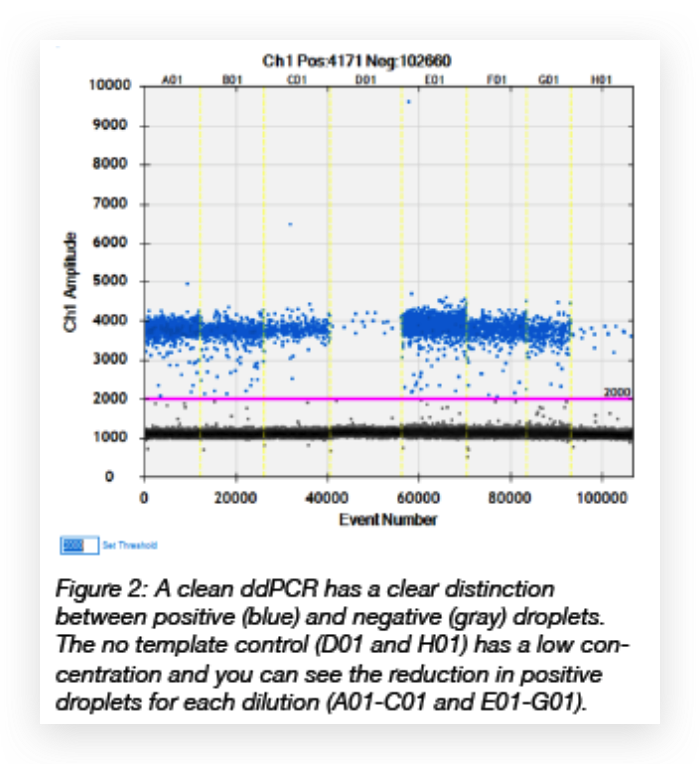
The ddPCR software uses the ratio of positive to negative droplets is used to calculate the concentration of the sample. This concentration can then be used to calculate the viral titer:

GC/mL = {[(R*C)(1000/V)]*D}

R = Reaction volume

C = Copies/uL

V = Volume of virus in reaction mix

D = Dilution factor of virus

Most droplet readers have a few channels for detecting fluorescence so that it is possible to measure the concentration of multiple targets simultaneously. For AAV titration, you should only need to use one. However, two channels can be used to examine the integrity of the viral genome (Furuta-Hanawa et al., 2019).

Tips and tricks for performing ddPCR

Clean everything

You must have a clean working area to titer your AAV by ddPCR. Droplet digital PCR is a sensitive assay, so cross contamination into a no template control (NTC) well is common. Here are some steps you can take to achieve a clean NTC:

(1) Have a dedicated bench with a dedicated set of pipettes for ddPCR set-up.
(2) Prepare the master mix in a separate area from where you prepare your sample dilutions.
(3) Aliquot all of your reagents into single-use tubes and grab a fresh one for each set up.
(4) Wipe down the bench and all consumables with 10% bleach.

Pipette slowly
If you are using a manual droplet generator, you will have to be careful about transferring your droplets from the droplet generator to the PCR plate. Maintaining a high droplet count is important for calculating the concentration of your sample.

Even if you are using an automated droplet generator, you should avoid pipetting too quickly when making your virus dilutions. This will reduce aerosols that could potentially lead to contamination.

Optimize your PCR
For a good starting place on what PCR parameters to use, see Lock’s seminal paper on AAV titration (Lock et al., 2014).

If you are having difficulty getting a clean separation between positive and negative droplets with these parameters, here are a few things you can try:

(1) Increase the number of cycles. After additional rounds of amplification, your fluorescence amplitude will increase, leading to greater separation of your positive and negative droplets. No more than 50 cycles is recommended.
(2) Decrease your ramp rate. A rate of 2C/s is recommended to ensure an even temperature change among all of the droplets, but you can go as low as 1C/s.
(3) Increasing the elongation time to 2 minutes and the denaturation time to 1 minute has been shown to increase droplet separation (Witte et al., 2016). This is particularly important if your amplicon is longer than 150 base pairs.

While we use ddPCR for AAV titration, there are many applications for the technology. Droplet digital PCR is well suited for the detection of low copy numbers. For this reason, it can be used in the detection of rare sequences and single cell analysis. It is also being used in the detection of microbes. Some applications include measuring viable probiotics and detecting circulating pathogens.

With its many applications and ease of use, droplet digital PCR is becoming a popular option for PCR experiments.

References

Furuta-Hanawa, Birei, Teruhide Yamaguchi, and Eriko Uchida. “2D droplet digital PCR as a tool for titration and integrity evaluation of recombinant adeno-associated viral vectors.” Human Gene Therapy ja (2019). PubMed PMID: 31140327. PubMed Central PMCID: PMC6707039.

Gobert, Guillaume, et al. “Droplet digital PCR improves absolute quantification of viable lactic acid bacteria in faecal samples.” Journal of microbiological methods 148 (2018): 64-73. PubMed PMID: 29548643.

Lock, Martin, et al. “Absolute determination of single-stranded and self-complementary adeno-associated viral vector genome titers by droplet digital PCR.” Human gene therapy methods 25.2 (2013): 115-125. PubMed PMID: 24328707. PubMed Central PMCID: PMC3991984.

Song, Neng, et al. “Detection of circulating Mycobacterium tuberculosis-specific DNA by droplet digital PCR for vaccine evaluation in challenged monkeys and TB diagnosis.” Emerging microbes & infections 7.1 (2018): 1-9. PubMed PMID: 29691363. PubMed Central PMCID: PMC5915492.

Witte, Anna Kristina, et al. “A systematic investigation of parameters influencing droplet rain in the Listeria monocytogenes prfA assay-reduction of ambiguous results in ddPCR.” PloS one 11.12 (2016): e0168179. PubMed PMID: 27992475. PubMed Central PMCID: PMC5167268.

Illumina index sequencing – where is my sample?

Illumina-paired-end-indexing.png

Indexed sequencing is vital to the delivering cost-effective, and statistically robust, experiments. Nearly all non-WGS projects are indexed to some degree so understanding how the indexing works is useful; fortunately Illumina produced this handy guide for users: Indexed sequencing overview. After indexed sequencing our reads are demultiplexed into sample specific fastq, and the reads that could not be assigned to an index in the samplesheet are dumped into a “lost reads”file. However we often get users asking us what the reads are that appear to be “lost”?

Usually only a small percentage of reads are “lost” but occasionally this can be 10% or higher. Remember that the “lost” reads are ones that could not be assigned to an index in the samplesheet, so looking carefully at the index sequences reported as lost usually enables us to work out what went wrong; and there are three main issues we watch for:

  1. Samplesheet error: the most common problem is simply that the wrong index was entered into the samplesheet. Because of this one of the indexes reported as being present will have zero reads, and one of the “lost” indexes will have the expected number of reads for the sample. It is usually obvious to the user once pointed out, it is easily fixed before the event (get your samplesheet right) but a little tricky to sort our afterwards.
  2. Unexpected indexes: Usually the unexpected indexes are at very low levels compared to the sample and are caused by sequencing errors and the like. However two cases can generate relatively high numbers of “lost” reads:
    1. PhiX: The PhiX control library does not have any index sequences and uses older adapters (Illumina should fix this for so many reasons; Seqmatic have an indexed version). The i7 indexing primer does not bind and the absence of signal generates the AAAAAAAA i7 read on most (all?) sequencers. The HiSeq 4000 uses the grafted p5 index primer which will typically generate the AGATCTCG sequence read from the PhiX adapter in the i5 read. The “lost reads” file contains a percentage of seequences, proportional to the PhiX loaded, with the AAAAAAAA,AGATCTCG index.
    2. Single-index contamination:  Similarly to PPhiX, but much less frequently, we can see indexes with the NNNNNNNN i5 and TCTTTCCC i7 reads. These have been previously identified as “contamination” of a dual indexed library with one that is single indexed (which wouldn’t have any i5 index, hence the NNNNNNNN sequence)
  3. Low quality index sequencing: If something happens during index sequencing and a base is lost or quality drops for some other reason then more reads can appear in the “lost reads” file. If this goes above 10% we’ll talk to the user first to find out if their analysis will be affected by either lower yield, or by increasing the number of index mismatches. If there are likely ot be problems then we would ask Illumina to replace the run due to the lower than expected yield.

PS: most of what I have written here is for HiSeq 4000 paired-end dual-indexed sequencing, read Illumina’s guide if you are doing something else!.

This blog is written by http://enseqlopedia.com/2018/01/illumina-index-sequencing-sample/

重温google搜索技巧

1. Use Advanced Search Operators

Want results from just one site? You can use the site:operator to limit your search. For example, search “site:cnn.com stock market,” and you’ll get related results from just the site you specified.

Google Search Site Operator

Looking for a PDF copy of a report or a slideshow presentation? Google will let you search for files of a specific type – including PDFs, Word docs, rich text files and more – with the filetype: operator.

To use this operator, simply type it plus the filetype you’re looking for, along with your query. For example, “filetype:pdf 2020 report” will return PDFs that include “2020 report” in their body, URL or title.

Google Search Filetype Operator

Google also provides operators that let you tell the search engine to only look for your query in a page’s URL, title or body – the allinurl:, allintitle: and allintext: operators.

For example, if you just want to find the words “Facebook updates” in a page’s body, you can search “allintext: Facebook updates.” A search like “allinurl: Facebook updates” will look just in page URLs, and “allintitle: Facebook updates” will look just in page titles.

Google Search Operators News Facebook Updates

Using the related: operator, you can find sites that are related to a specific URL. For example, searching for “related:amazon.com” will provide sites related to Amazon’s homepage.

You can use this operator to quickly search for concepts related to a site or quickly get a sense of how Google is categorizing a given site, based on the related sites it returns.

If you need to limit your searches even further, there are even more Google search operators that you can use to limit your search.

Need to view a website that’s down or want to take a look at an older version of a site? Google regularly stores digital snapshots of websites that you can access using the related:operator. Simply combine the operator with a URL – as in cache:google.com– and you’ll be taken to a stored version of the website.

You can also search within a range by using the ellipses (two dots: ..) operator. When combined with a pair of numbers, this operator tells Google to only look for results that fall within a certain range.

So, if you’re looking for a speaker within a certain price range, you can perform a search like “Linux $100..$250” to find what you’re looking for.

2. Use the Asterisk Wildcard

In a Google search, an asterisk (*) can stand in for any word. So if you’re looking for a specific phrase but can’t remember one or more words, you can type in the part of the phrase you know and tell Google to sub in anything else by using an asterisk.

For example, the search “war and *” will get you results similar to a search for “war and peace.” You can also use more than one asterisk to sub in for multiple words – a search like “to be or * * be” will return results like the search “to be or not to be.”

Google Search Operators War And Peace

3. Perform Basic Math and Quick Unit Conversions

You can use a Google search to quickly perform basic calculations. Type in a math problem – like “4 x 4 + 10” – and Google will return a search with a calculator widget at the top of the results page. The widget will be pre-filled with your problem and its answer.

Google Search Calculator

The Google calculator can also perform more advanced operations like finding the square root of a number or the sine of a given angle.

You can also use Google to quickly convert from one unit of measurement or currency to another. For example, “3 cm to inches” will return the equivalent length of 3 cm in inches, while “500 USD to GBP” will return the value of 500 dollars in pounds.

Google Search Conversion

4. Search Using Boolean Operators

Need to search for a specific term but your results are clogged up with a related word you don’t need information on? Or do you need a broad search that can include either of two different terms? In cases like these, you can use simple Boolean operators — andnot and or — to make your Google searches more specific.

Searching for “camera AND video” will only return results with both the words camera and video. Searching for “camera OR video” will return results with either of the words.  If you don’t need a word, you can exclude it from your searches with NOT, as in “camera NOT video.”

OR and NOT can also be replaced with specific characters that will perform the same function – the vertical bar (|) for OR and the hyphen or minus sign (-) for NOT.

Google Search Operators Quotes Omit

Be sure to keep your operators capitalized, otherwise Google will treat them as part of what you’re searching for rather than an operator.

靶向另式剪接的反义寡核苷酸设计

Considering that there are approximately 30,000 human genes and that up to 60% are alternatively spliced, this new antisense approach may have far-reaching implications in the treatment of a variety of diseases. Oligonucleotides can be used to silence mutations that cause aberrant splicing, thus restoring correct splicing and function of the defective gene. This is important since close to 50% of genetic disorders are caused by mutations that cause defects in pre-mRNA splicing. Thus, targeting splicing with antisense oligonucleotides significantly extends the clinical potential of these compounds.

Examples of Splice Modulating ASO Drugs

In December 2016, Ionis Pharmaceuticals announced that the U.S. Food and Drug Administration (FDA) had approved nusinersen for the treatment of spinal muscular atrophy (SMA) in pediatric and adult patients. SMA is a leading genetic cause of death in infants and toddlers, marked by progressive and debilitating muscle weakness. According to Chiriboga et al., nusinersen is a 2’-O-(2-methoxyethyl) (MOE) phosphorothioate (PS)-modified ASO designed to alter splicing of SMN2 mRNA and increase the amount of functional SMN protein produced, thus compensating for the genetic defect in the SMN1 gene.

In December 2018, Sarepta Therapeutics announced that it had completed the submission of a New Drug Application (NDA) seeking accelerated approval for golodirsen, a phosphordiamidate morpholino oligomer (PMO, depicted here) for treatment of patients with Duchenne muscular dystrophy (DMD), who have genetic mutations subject to skipping exon 53 of the Duchenne gene. Duchenne is a fatal genetic neuromuscular disorder affecting an estimated one in approximately every 3,500 – 5,000 males born, worldwide.

In addition, the announcement stated that Sarepta’s eteplirsen PMO for DMD in patients with a confirmed mutation of the DMD gene amenable to exon 51 skipping, had also been approved under accelerated approval based on the increased dystrophin levels in skeletal muscle observed in some patients treated with this drug. However, a clinical benefit of eteplirsen has not been established, meaning that continued approval for this indication may be contingent upon verification of a clinical benefit in confirmatory trials.

In December 2018, ProQR Therapeutics announced a publication in Nature Medicine regarding the results of a clinical trial investigating its splice modulating ASO, QR-110, for the treatment of Leber’s congenital amaurosis 10 (LCA10), a rare but severe form of childhood blindness. LCA10 is an inherited retinal dystrophy associated with mutations in the CEP290 gene. QR-110 is a single-stranded, fully PS- and 2′-O-methyl (2’-OMe)-modified RNA oligonucleotide designed to correct the splicing defect resulting from the CEP290 c.2991+1655A>G mutation, which is the underlying cause of LCA10. QR-110 is designed to restore normal (wild-type) CEP290 mRNA, leading to the production of normal CEP290 protein. QR-110 is intended to be administered through intravitreal injections in the eye, and it has been granted orphan drug designation in the United States and the European Union, receiving fast-track designation by the FDA.

Systematic Development of Splice Modulating ASOs

Despite the proven utility of splice modulating ASOs and increasing interest in this mechanistic class of nucleic acids, published information on the design of these compounds is scarce. Wilton and collaborators have addressed this issue in a September 2019 publication, briefly summarized below. Readers interested in details should consult the full paper at this link.

According to these researchers, splice modulating ASOs are designed to hybridize to elements within or flanking an exon, thereby influencing its recognition by the spliceosome (depicted here) so that the exon is preferentially retained or excised from the mature mRNA, as required. They add that redirection of splicing is presumably a consequence of the ASO preventing positive (enhancer) or negative (silencer) splicing factors from recognizing enhancer or silencer elements in the pre-mRNA transcript. Steric hindrance by the ASO at these sites alters the recognition of normal splice sites by the splicing machinery, leading to alternative selection of exons or intronic sequences in the targeted transcript.

Wilton and collaborators state that several Web-based tools have facilitated the prediction of potential splice factor motifs in any given sequence, and that bioinformatics can contribute to the design of splice switching ASOs. While it is relatively straightforward to target AOs to predicted enhancer or silencer motifs, or to confirmed splice donor or acceptor sites, they cite published examples on how this approach does not consistently yield effective splice altering ASO sequences. In their opinion, “identifying target domains within a pre-mRNA that influence splicing and then refining ASO design through micro-walking [exemplified here] must be done empirically.”

intron-1024x299.png

RT-PCR analysis of ITGA4 transcripts demonstrating refinement of splice switching ASOs targeting ITGA4 exon 3. ASOs tested in a first screen are indicated by red lines and the micro-walked ASOs tested in a second screen are represented by blue lines. Nucleotide positions are -/+ numbers and levels of exon skipping after transfection at 100 nM are % values. Taken from Aung-Htut et al. Int. J. Mol. Sci. 2019, 20(20), 5030 and free to use.

To date, Wilton and collaborators have screened over 5,000 ASOs as potential splice modulating agents directed at numerous gene transcripts linked to genetic diseases that may be potentially amenable to a splice intervention therapy. In addition, they have explored non-productive splicing to downregulate expression of selected gene transcripts. This was achieved through induction of non-functional isoforms by either the excision of exons encoding crucial functional domains, or disruption of the reading frame. Consequently, these researchers have developed the following general guidelines, which are efficient and effective in developing biologically active splice switching ASOs:

1) The pre-mRNA sequence is interrogated by one or more in silico prediction programs to identify potential splice enhancer or silencer motifs.
2) Antisense oligonucleotides, typically 20- to 25-mers, are designed to anneal to the target motifs and are synthesized with 2′-OMe nucleobases and PS linkages throughout. (Note: 2’-OMe/PS-modified ASOs are available from TriLink BioTechnologies)
The test compounds are complexed with cationic liposome preparations and transfected into cells.
3) After incubation, total RNA is extracted and the target transcript is amplified using RT-PCR to assess differences in pre-mRNA processing, with and without ASO treatment.
4) Oligomers shown to induce the desired changes in pre-mRNA processing are further refined by micro-walking around the annealing site and/or altering AO length.
5) Transfection studies over a range of concentrations are performed to identify compound(s) that modify splicing in a dose-dependent manner, and at the lowest concentration.

Comments on These Guidelines

According to Wilton and collaborators, the use of negative ASO control sequences, whether they be random, scrambled, or unrelated, is essential to confirm specific target modification. Establishing target specificity is particularly crucial in situations where gene downregulation is the desired outcome. However, in many cases of splice switching (either exon skipping, exon retention, or intron retention), the presence of a novel transcript is proof of the anticipated antisense mechanism.

The researchers further note that, depending on the gene and targeted exon, up to two-out-of-three ASOs designed in a first pass can induce some level of exon skipping. However, targeting certain motifs noticeably results in more efficient exon skipping than others, and when developing any ASO for clinical use, the most appropriate compound will be one that induces robust splice switching at a low concentration.

The use of a positive transfection control ASO is recommended for each transfection experiment, as this can control for transfection efficiencies across different experiments. It is also important to note that cell confluency, passage number, and other culture conditions can substantially influence transfection efficiency in primary cells and may lead to variations in ASO efficacy between biological replicates.

In some cases, individual ASOs were ineffective at modifying exon selection, even after transfection at high concentrations. Wilton and collaborators state that they have frequently found that selective ASO “cocktails”, which include two or more ASOs used in conjunction for a given exon target, mediate exon skipping in a synergistic manner, while each ASO transfected alone is ineffective. Conversely, they have also observed a marked decrease in exon skipping efficiency when two highly effective AOs are combined.

Wilton et al. also recommend confirming the identity of putative exon-skipped products by direct DNA sequencing, as nearby cryptic splice sites may be activated, resulting in the generation of amplicons of similar length to the expected product. A difference of only a few bases in length can be difficult to resolve on an agarose gel, and such differences would be impossible to detect in longer RT-PCR products representing multiple exons.

Upon identification of amenable sites in the pre-mRNA that induce the desired splice modulation, ASOs can be further optimized by micro-walking and shifting the ASO annealing sites in either direction to ensure the most amenable splice motifs have been targeted, as was depicted and exemplified above. If considered necessary and of particular relevance, further micro-walking can be undertaken by moving the lead ASO candidate target sequence a few nucleotides in either the 5′ or 3′ direction. Finally, systematic truncation of a lead ASO can provide the shortest ASO that retains the desired level of potency.

Concluding Remarks

This blog started off by noting the pioneering work of Ryszard Kole, which was first reviewed by Kole et al. in an article titled RNA modulation, repair and remodeling by splice switching oligonucleotides published in Acta Biochimica Polonica in 2004. This initial review, published in a relatively obscure Polish journal, is freely downloadable at this link for readers interested in learning more about the “early days” of this exciting field. The introduction provides the following historical statement that’s worth mentioning:

The cited seminal paper in 1993 in PNAS by Dominski (a postdoctoral student) and Kole is also freely available at this link. The aforementioned review by Kole et al., depicted as the single data point for 2004 in the graph below, has been succeeded by a rapidly increasing number of annual publications in PubMed.Given this trend, and the clinical development of splice modulating ASOs discussed in this blog, it seems likely that future successes will follow for this novel mechanistic class of modified oligonucleotides as therapeutic agents for genetic diseases.

pubmed-640x385.png

THIS IS ADAPTED FROM: http://zon.trilinkbiotech.com/2019/11/26/splice-modulating-antisense-oligonucleotides/

高分子量PEG在DNA快速连接反应中的应用

Buy a Quick Ligation Kit

The most convenient way to perform faster ligations is to buy a quick ligation kit, such as one of these:

These kits enable 5- to 15-minute ligations at room temperature. What’s the secret behind these faster ligation reactions? A simple addition to the ligation reaction buffer: polyethylene glycol (PEG).

How Does PEG Make Ligations Faster?

PEG is an inert polymer that comes in many sizes, ranging from low molecular weight (MW) forms to much larger MW forms. This is the key behind PEG: it makes ligation reactions faster by simply removing empty space in your ligation reaction, a phenomenon called macromolecular crowding or volume exclusion. [1] Other crowding agents (e.g., Ficoll, albumin) exert similar effects, but not as potently as PEG. [1, 2] By excluding volume from your ligation reaction, you increase the effective concentration of DNA termini, making it much more likely that they’ll associate and be ligated by your ligase.

But why does this work? Interestingly, crowded reaction conditions better reflect the intracellular environments in which many enzymes, including DNA ligases, operate endogenously. [1] Thus, it follows that such enzymes would be highly efficient under such conditions, particularly when compared to the artificially sparse conditions found in typical ligation reactions. This difference is most striking in the case of blunt-end ligations, which occur at much lower frequencies than their sticky-end counterparts.

How to Make Your Own Buffer for Faster Ligations

Buying a quick ligation kit may be convenient, but convenience generally comes with a cost. For a more economical solution (no pun intended), use the following recipe as a starting point:

2x Buffer for Faster Ligations [3]:
  • 132 mM Tris (pH 7.6)
  • 20 mM MgCl2
  • 2 mM DTT
  • 2 mM ATP
  • 15% PEG (MW 6000)

When customizing your own quick ligation reactions, keep the following tips in mind:

  • The use of high MW PEGs is critical, as lower MW PEGs do not confer any reaction benefits. [1] Typically, PEG-6000 is used (anything between 3000 and 8000 should work fine).
  • Do not use too much (or too little) PEG. Start with 5-7.5% PEG (final concentration) and avoid going over 10%. The recipe above has a final PEG concentration of 7.5%.
  • Higher concentrations of DNA ligase and divalent cations (e.g., Mg2+) will favor the formation of intermolecular ligation products. [4] This is good because plasmid DNA ligations require intermolecular ligation between the insert and vector first. This is likely why NEB’s quick ligation buffer contains tenfold more MgCl2 than its standard DNA ligase buffer. However, excess ligase/cations will inhibit the next step, where the ligation product is circularized by intramolecular ligation. Avoid excessive amounts of ligase and divalent cations.

Troubleshooting PEG-Containing Ligation Reactions

Although PEG delivers faster ligation reactions, it can decrease the efficiency of bacterial transformations under certain conditions. Although the mechanisms that underlie this phenomenon are still unknown, it is possible that conditions such as heat and incubation time favor the formation of long DNA concatemers over circularized DNA. [2, 5]

  • Do not let your ligation reaction exceed 2 hours. Typically, all you need is 5 minutes for sticky-end ligations and 15 minutes for blunt-end ligations.
  • DO NOT HEAT INACTIVATE. Although it is recommended for some ligation reactions, heat inactivation of PEG-containing reactions will cause your transformations to fail.
  • When in doubt, clean up your reaction before transformation. This can be done by spin column, precipitation, or drop dialysis. This is absolutely required when using electroporation to transform your bacteria. For other transformation methods, clean up may not be required; in fact, PEG may actually confer a mild stimulatory effect in such cases. [6]

Here are more ligation tips:

1. Aliquot the ligase buffer
The ATP in the ligase buffer is essential for the DNA ligation reaction, but is broken down by repeated freeze-thaw cycles. To avoid this, aliquot the ligase buffer from each new stock of DNA ligase. Make the aliquots small enough for single-use (e.g. 5 µL), and make sure to completely defrost and mix your buffer well before you aliquot.

2. Heat the DNA just before ligation
When setting up a cohesive-ended ligation, mix the vector and insert fragments first and heat to 65°C for 5 minutes before adding the remaining reaction components. This heating step disrupts any vector/vector or insert/insert cohesive-end interactions that may otherwise interfere with the desired vector/insert interaction, reducing ligation efficiency.

3. Check the pH
The optimum pH range for DNA ligation is between 7.6 and 8.0. Depending on how the DNA fragments were prepared, the pH of your ligation mixture may lie outside of this range. You can check the pH of your ligation mixture by pipetting approximately 0.2 µL of the mix onto narrow range pH paper (e.g. pH 6-8). If required, adjust the pH using 0.2 µL drops of 2M Tris base or 1M HCl.

4. Include polyethylene glycol (PEG)
As with any chemical reaction, the concentration of the reaction components can greatly influence the speed of the ligation reaction. PEG is a hydrophobic molecule that takes up space in the reaction, effectively increasing the concentration of the aqueous reaction components e.g. DNA, ATP and ligase. Adding PEG (e.g. PEG 8000) to a final concentration of 5-15% may increase ligation efficiency. Bear in mind however that PEG concentrations above 5% can reduce transformation efficiency. In addition, heat inactivation or extended incubation of ligation reactions containing PEG can also decrease transformation efficiency.

5. Add a restriction enzyme just before transformation
This neat trick can be used to circumvent high background resulting from undigested vector. If the vector fragment removed during the preparative digest contains a unique restriction site, adding the respective restriction enzyme to the ligation reaction will selectively digest any intact vector, preventing it from being transformed. Adding 1 µL of the enzyme 5-10 minutes prior to transformation should be sufficient.

参考文献:

【1】S. B. Zimmerman, B. H. Pheiffer, Macromolecular crowding allows blunt-end ligation by DNA ligases from rat liver or Escherichia coli. Proc Natl Acad Sci U S A 80, 5852-6 (1983).
【2】 S. B. Zimmerman, B. Harrison, Macromolecular crowding accelerates the cohesion of DNA fragments with complementary termini. Nucleic Acids Res 13, 2241-9 (1985).
【3】Datasheet for New England Biolabs’ Quick Ligation Kit (PDF).
【4】K. Hayashi, M. Nakazawa, Y. Ishizaki, N. Hiraoka, A. Obayashi, Regulation of inter- and intramolecular ligation with T4 DNA ligase in the presence of polyethylene glycol. Nucleic Acids Res 14, 7617-31 (1986).
【5】D. Louie, P. Serwer, Effects of temperature on excluded volume-promoted cyclization and concatemerization of cohesive-ended DNA longer than 0.04 Mb. Nucleic Acids Res 19, 3047-54 (1991).
【6】B. H. Pheiffer, S. B. Zimmerman, Polymer-stimulated ligation: enhanced blunt- or cohesive-end ligation of DNA or deoxyribooligonucleotides by T4 DNA ligase in polymer solutions. Nucleic Acids Res 11, 7853-71 (1983).


重温经典:Laemmli Buffer的作用原理

Electrophoresis encompasses a wide range of techniques in which charged biomolecules in a liquid, a solid, or a semisolid solution can be separated by size under the application of an electric field. The most common application of electrophoresis for the separation of proteins is SDS-PAGE (sodium dodecyl sulfate-polyacrylamide gel electrophoresis), which has been previously covered here.

The most important step of electrophoresis is actually the extraction of proteins from a sample. During this process certain conditions need to be met in order to get an optimal result. Although protein extraction methods can vary, Laemmli buffer is a constant in nearly all protocols.

Taking its name from Prof. Ulrich K. Laemmli who refined the procedure of SDS-PAGE in the 1970s, Laemmli buffer creates excellent conditions for quality separation of proteins based on their size. Laemmli buffer contains: (1) sodium dodecyl sulfate (SDS); (2) a thiol agent; (3) glycerol; (4) tris-hydroxymethyl-aminomethane (tris); and (5) a color agent, like bromophenol blue. In order for someone to be able to master the technique of SDS-PAGE it is useful to know the reason and chemistry behind all of these reagents.

The Line-Up
1. SDS
Well-known as a detergent, SDS denaturates proteins by disrupting non-covalent linkages and destabilizing natural conformations. By acting as an anionic surfactant, it imparts net negative charge on proteins, causing repulsion between amino acids, which leads to protein unfolding and a somewhat trend towards linearization. It is estimated that 1.4 gram of SDS can bind 1 gram of protein.

The same principal is taken into consideration when SDS is used in hygiene industry and more specifically as detergent to successfully remove stains. The amphipathic nature of SDS, along with its denaturation function, allows the detergent to easily remove proteins or fatty acids of a stain.

2. Thiol agent
Thiol agents, such as beta-mercaeptoethanol or dithiothreitol (DTT), are used to reduce the disulphide bonds created between sulphur containing amino acids like cysteines. Also, because thiol agents have antioxidant properties, they are able to prevent oxidation of cysteines. Thus, thiol agents work with SDS for successful protein linearization.

3. Glycerol
Once your samples have been successfully linearized, it is time to get them set up in the wells of the gel you are using for electrophoresis. To ensure that your protein sample(s) won’t float away, high-density glycerol is included in Laemmli buffer, essentially weighing your sample down so it stays in its designated well.

4. Tris
During SDS-PAGE, Tris is being used to control three different pH levels. However, when it is a part of the Laemmli buffer, Tris functions to maintain pH 6.8 to stabilize your protein extract for several days at the fridge, without compromising your proteins. At the same time, Tris can inhibit enzymatic reactions and prevent cell proteases from degrading your proteins of interest.

5. Colour agent
Finally a colour agent (or dye) like bromophenol blue is useful for visualizing your sample in the well and tracking its progress through the gel later.

How to Use Laemmli Buffer
For your notebook, a common and easy to make recipe for a 2X concentrated Laemmli buffer is: 4% SDS, 10% beta-mercaeptoethanol, 20% glycerol, 0.1 M Tris pH 6.8, and 0.005% of bromophenol blue.

A concentrated Laemmli buffer can be stored at 4oC for at least a year without worrying about its effectiveness. It is always a good idea to make a 2X or 5X stock and dilute it during your protein extraction.

So now you have the know-how in order prepare your proteins for successful electrophoresis, but also how detergents are working inside your washing machine. Two birds with one stone!

References
Laemmli, U. K. (1970). Cleavage of structural proteins during the assembly of the head of bacteriophage T4. nature, 227(5259), 680.

怎样选择一个合适的Cas9?

Considerations when planning your Cas9 experiment

When choosing the Cas9 nuclease for your experiments, there are three important factors to consider: site accessibility, specificity, and sensitivity.

Site accessibility
Site accessibility is a measure of which genomic sequences can be targeted by the Cas9. This is determined by the PAM sequence recognized by the nuclease. For the most frequently used Cas9, spCas9 from Streptococcus pyogenes, this sequence is 3’-NGG. But Cas9s found in other species can recognize a variety of different PAM sequences. Researchers have also used experimental evolution to develop Cas9s that have a broader PAM specificity, allowing for the targeting of sites that were previously unavailable.

Specificity
Specificity is the assessment of the off-target activity of Cas9. This can occur when Cas9 cleaves a site that is not a perfect match to the guide RNA (gRNA) used to target the genomic locus of interest. As these off-target effects can be genome-wide and, in some cases, difficult to determine, the potential for off-target cleavage should be an important consideration during any experiment.

Sensitivity
Cas9 sensitivity is often closely related to specificity. Sensitivity is a measure of the on-target activity of the Cas9 nuclease. This can be determined by measuring the indel frequency at a target site. A specificity ratio can be measured by calculating the on-target activity divided by the off-target activity.

Cas9 nucleases that exhibit enhanced site accessibility

In order to generate a genomic alteration at a specific location, it must be accessible by Cas9. Our previous blog post The PAM Requirement and Expanding CRISPR Beyond SpCas9 described the PAM specificity of Cas9s isolated from different organisms and engineered Cas9 variants that were able to target different PAM sites (NGG, NGAN, NGNG, NGAG, and NGCG). Since then, the Osamu Nureki Lab described a rationally engineered Cas9, SpCas9-NG, which required only the di-nucleotide PAM NG (Nishimasu et al., 2018). The David Liu Lab similarly described xCas9, which displayed the ability to target multiple PAM sequences (NG, GAA, and GT), greatly increasing the number of genomic loci that can be targeted (Hu et al., 2018).

These altered variants can allow for targeting of your genomic loci of interest that may not be accessible by wild-type Cas9, due to its stringent PAM specificity. This can be especially important for base editing techniques, where Cas9 must be directed to a very specific site.

Specificity vs. sensitivity in choosing the Cas9 to use in your experiments

Another important consideration when choosing a Cas9 is balancing specificity and sensitivity. Wild-type Cas9 exhibits high on-target activity, but also high off-target activity, which may be undesirable in many applications. At the time of our first blog post on choosing a Cas9, the Feng Zhang Lab had described eSpCas9, while the Keith Joung Lab had developed SpCas9-HF1. Both of the enzymes showed decreased off-target activity relative to Cas9. Since then, the Joung and Jennifer Doudna Labs used targeted mutagenesis to generate hyper accurate Cas9 (HypaCas9). This nuclease showed decreased or similar off-target activity, relative to eSpCas9 and SpCas9-HF across a number of different sites. Using a combined random and directed mutagenesis approach, the Anna Cereseto Lab created pX-evoCas9, which they showed also increased specificity.

Most recently, the Jungjoon Lee Lab used directed evolution to generate Sniper-Cas9 resulting in a Cas9 with improved specificity. They compared on-site and off-site activity of Sniper-Cas9 to different Cas9 variants using gRNAs of different lengths (Lee et al., 2018) and found that Sniper-Cas9 showed a high degree of both specificity and sensitivity across a large number of loci and gRNA lengths.

Recent alternatives to Cas9

While Cas9 remains the most widely used CRISPR nuclease, recent work has shown that alternative enzymes may better suit specific experimental approaches. One example is CasX, characterized by the Oakes and Doudna Labs, which is both small and potentially less likely to elicit a strong immune response, factors that may make it especially suitable for in vivo research and potentially treatments. Cas12b, characterized by the Zhang (Strecker et al., 2019) and Li (Teng et al., 2018) Labs also shows promise for in vivo research due to its small size and specificity relative to Cas9. As scientists continue to characterize CRISPR nucleases from a variety of sources, it is likely that the toolkit available to researchers will continue to expand.

Final thoughts

Since the first use of Cas9 to engineer the genome, there are more and more Cas enzymes and variants to choose from. While no enzyme is perfect for all experimental approaches, knowledge of both the advantages and limitations of each Cas enzyme can help determine which enzyme to use. Remember, accessibility, specificity, and sensitivity are key considerations in choosing a Cas protein for your experiment.

References

Hu, Johnny H., et al. “Evolved Cas9 variants with broad PAM compatibility and high DNA specificity.” Nature 556.7699 (2018): 57. PubMed PMID: 29512652. PubMed Central PMCID: PMC5951633.

Lee, Jungjoon K., et al. “Directed evolution of CRISPR-Cas9 to increase its specificity.” Nature communications 9.1 (2018): 3048. PubMed PMID: 30082838. PubMed Central PMCID: PMC6078992.

Nishimasu, Hiroshi, et al. “Engineered CRISPR-Cas9 nuclease with expanded targeting space.” Science 361.6408 (2018): 1259-1262. PubMed PMID: 30166441. PubMed Central PMCID: PMC6368452.

Strecker, Jonathan, et al. “Engineering of CRISPR-Cas12b for human genome editing.” Nature communications 10.1 (2019): 212. PubMed PMID: 30670702. PubMed Central PMCID: PMC6342934.

Teng, Fei, et al. “Repurposing CRISPR-Cas12b for mammalian genome engineering.” Cell discovery 4.1 (2018): 63. PubMed PMID: 30510770. PubMed Central PMCID: PMC6255809.

Nanopore测序文库制备技巧

Nanopore is a relatively new sequencing platform and researchers are still trying to optimize the protocol for their own specific applications. In our lab, we work primarily with metagenomic samples and use the 1D sequencing kits. Over the past year, we have optimized this technique. To check the quality of the Nanopore library preparation we check between steps using Qubit and Nanodrop measurements. Nanopore library quality mostly depends on the individual researcher’s technical skills and pipetting technique. In this article, we discuss some pointers to perform a successful NGS library preparation for metagenomics sequencing on the MinION platform.

Use High-Quantity Starting Material

The recommended starting material for DNA sequencing is <1 ug. However, we have observed in our experiments that with a little higher quantity (around 1.5 times) of DNA, the final library concentration will be within the desired range. It is a well-known fact that higher the library concentration the better the sequencing result. We have observed the same with our own experiments. Nevertheless, it is not always easy to get high quality DNA in sufficient concentration. Pooling of samples, if possible, can be done totry and improve the concentration. Alternatively, you can use PCR followed by purification of desired bands using gel extraction kits.

Use High-Quality Nucleic Acids

We recommend using a fluorometer to measure DNA/RNA concentrations as Nanodrop readings for concentration is not always reliable. However, the absorbance ratios at 260/280 and 260/230 measured in Nanodrop are very useful. The 260/280 ratio for DNA should always be in the range of 1.7 – 1.9. The closer it is to 1.8, the better the results. The 260/230 ratio should higher than 2.0. For RNA, the 260/280 ratio should be around 2.0 and the 260/230 ratio should be above 2.0. Read more about the strengths and limitations of your nanodrop.

If possible, the quality of DNA/RNA should also be measured using Bio-analyser/Tape station along with traditional methods. As there are no steps to check the quality once the library preparation starts, it is better to start with a high-quality sample rather than searching for issues in case of poor sequencing data. Real time PCR kits are available to check library prep quality but this adds to the cost and time of experiment.

Consider the optimal DNA fragment size

The DNA fragment size also impacts the quality of the sequencing reads and we spent a lot of our time determining the optimal fragment size for Nanopore sequencing.

We found that the optimal size was between 3 Kb and 8 Kb. Fragments smaller than 1-2 Kb greatly reduced the overall sequencing quality, whereas higher molecular weight DNA fragments (10 Kb to 40 Kb which are common in manual DNA preparations) do not interfere with overall quality of data. Some Nanopore users have reported clogging of pores when using high molecular weight DNA and recommend the new flow cell wash kit to revive the clogged pores and prepare for the next run. Flow cell washing is recommended after every run and latest kit supposedly gives better yields when combined with a nuclease flush step.

The objective of Nanopore is long read sequencing but how long the reads should be (< 10 Kb or >10 Kb) is up to the scientist to decide depending on their individual experiment parameters. It should be noted that the overall fragment size distribution among all the samples in a single batch should be similar. Fragment length normalization and optimization will help to reduce the sequencing bias of heterogeneous samples. Steps should be taken to maintain a uniform fragment length distribution and should be normalized across samples. Fragment size also affects the efficiency of PCR barcoding steps. Longer fragments are difficult for PCR barcoding. End prep is another important step. Barcoding step affects the overall outcome of the sequencing. Insufficient barcoding leads to loss of valuable data.

Increase Your Incubation Times

We have observed that incubating the samples with beads for a longer duration gives better results. After mixing with the beads, we left the tubes idle for twice as long as suggested by the manufacturer’s protocol.

Use Fresh Beads

AMPure XP beads utilizes an optimized buffer to selectively bind DNA fragments 100 bp and larger to paramagnetic beads. Excess primers, nucleotides, salts, and enzymes can be removed using a simple washing procedure. Prepare fresh 70% ethanol each time to avoid dilution effect upon reuse due to the hygroscopic nature of 70% ethanol. We found that this simple step dramatically improves the bead utilization.

Minimize Tube Changes During Nanopore Library Preparation

We would recommend not transferring DNA from one tube to another unless it is absolutely necessary. For example, when eluting DNA from beads, you must collect the eluent in a fresh new sterile tube. This is primarily to avoid loss of sample during library preparation. The tubes and tips are not completely resistant to liquid sticking on the walls, and we feel it is better to avoid this rather than to try and retrieve the lost sample. Good pipetting practices will help you to minimize volume loss during such transfers. Additionally, we recommend using DNA LoBind Eppendorf® tubesfor all the steps.

Mix Your Samples Thoroughly… but Carefully!

The tube contents and reagents should be mixed properly. Even though vortexing is not recommended, light vortexing can be done in the initial steps. The most appropriate method for mixing is flicking the tubes. Pipette mixing can also be done, but this is not recommended as repeated pipetting may result in shearing of the DNA fragments affecting the size distribution. Again, proper pipetting skills are required to ensure that the sample is processed optimally.

Optimize Your PCR

In our experiments, we have observed that for PCR barcoding, the number of cycles can be doubled to 30 cycles. We did not get enough output with the recommended number of cycles (12 to 15 cycles). This may vary depending on the sample type and protocol but there is no harm in programming additional PCR cycles. Always check with Nanodrop and Qubit before and after such procedures to ensure consistency.

Prep Your DNA Before Ordering a New Flowcell

One of the major problems that we faced, other than the issues in Nanopore library preparation, was lower pore count of the MinION flowcell. Even though the company claims that there are 2048 pores, by the time we receive the flowcells, the count of pores is down to less than 1400. Having fewer pores directly impacts the quality and quantity of sequences/reads in the output. As the number of pores reduces, so does the confidence on the quality and quantity of the output data. Every day we lose a bunch of pores as these are biological and not chemical in nature and the longer the flowcell sits in the fridge the lower the capacity. So, we highly recommend preparing your DNA samples first – before ordering a new flowcell. As soon as you receive it, you should be able to start the experiment right away.

Make Sure You Have a Good Internet Connection

It must be noted that the most recent MinION flowcell can generate 30 GB raw data and close to 5 GB FASTQ data after basecalling. We have confirmed these numbers from our own experiments even at low pore counts of 1500 per flowcell. You need a high-speed broadband internet connection for real time basecalling. We recommend this approach as you can continuously monitor the data generated and stop the run when sufficient data is collected. You can immediately wash the flowcell and prime it for the next batch. This way you can reuse the flow cells for at least three library preps making it more economical compared to other sequencing platforms.

Common Practices to Keep in Mind for Nanopore Library Preparation

While working on the various experiments with Nanopore MinION, we figured out that the following practices greatly improved the final data output from sequencing:

  • The working bench, pipettes and all the consumables should be clean and dust free.
  • The reagents stored in -20°C should be thawed on ice before use and should be immediately returned to the proper storage area (-20°C) after use – use an ice bucket at all times.
  • The magnetic beads should be normalised to room temperature and resuspended properly before use.
  • As the library preparation protocols are not very long, try to finish the complete procedure within one day and start sequencing. Though there are steps after which the sample can be stored and the protocol continued the next day, it is better to avoid this scenario if possible.
  • Plan ahead of time to ensure all the equipment is readily available, start early and finish the entire process in one go without stops.

文章来源: https://bitesizebio.com/44244/get-prepped-nanopore-library-preparation-optimization/

如何彻底去除DNA污染?

Earlier I made a post about decontaminating solutions and how to homebrew them for cheap. I had one more patent to talk about but I felt kinda burnt out (and a bit guilty that I was bullying the decontaminating solution manufacturers association (DSMA) so much ), I ended up letting it sit for a bit. But this horse isn’t quite dead yet, as I think there’s some very useful information to be gleaned by examining the solution known as DNA Zap, from Thermo.

It’s a bit of an oddity, a TWO part cleaning solution meant to destroy nucleic acids, which you apply to an area one after another. Pretty…how you say, le fancy, non? Taking a peek at the MSDS will tell you that Part A contains copper sulfate, which I hadn’t encountered in decontaminating solutions before. WHY??? WHY DO YOU NEED COPPER SULFATE??? What magic is in the mix that can possibly improve on your standard soapy/bleachy/NaOH-y goodness?

Go read the patent, titled “METHOD OF MAKING A FORMULATION FOR DEACTIVATING NUCLEIC ACIDS” it’s fascinating. It’s written in legalese, but the amount of figures/tables/DATA proving the efficacy of this mixture is astounding! Hats off to the people who did all the work, what a nice bit of optimizing 🙂 It’s a pretty neat little system they’ve thought up.

Part A consists of copper sulfate (2 mM) and hydrogen peroxide (3%). This solution in and of itself will destroy nucleic acids on contact. They do not comment on the mechanism on which this works, though. Interestingly, the peroxide based inactivation has similarities to patents by Qiagen and the University of Montreal, which we covered in the last article.

Part B is a pH 9.3 solution of 0.6% hypochlorite (so basically 10% bleach? the authors used CLOROX which is ~6%), 90 mM Sodium Bicarbonate, 0.015% SDS and 0.0075% 2141-BG which is some weird proprietary fragrance which helps with solubility AND smells good? This is more in line with the classic RNase Away solutions. One important improvement to RNase-away-like mixes is sodium bicarbonate, which inhibits the corrosiveness of the bleach on lab equipment. Having watched bleach corrode the crap out of certain materials, the corrosion inhibition seems like a good call. The SDS and fragrance are wetting and emulsifying agents, respectively. The SDS needs the emulsifying agent to stay in solution. Both help the bleach/bicarbonate to make good contact with whatever mess you made (Fiillllthy, FILLLTTTHHHYYYYYYY!!!). The author notes that the bleach/bicarb solution itself is enough to destroy nucleic acids if you don’t have a high organic load.

So, why the two reagents together? Well, one reason is if you absolutely, positively HAVE to have 100% degradation of nucleic acid on the surface. If one of your reagents is diluted or absorbed by your mess, the second reagent acts as backup to ensure you have complete nucleic acid degradation. The dual action also seems to speed the effect of nucleic acid degradation, requiring no soak period. Wax on, wax off.

The inventors actually had labs compare the efficacy of 50% bleach (which is allegedly used in medical assays) VS Part A + Part B VS Only Part B. Turns out that while Part A + B are 100% effective in destroying nucleic acids, Part B by itself is still 99.3%. Now, how effective was 50% household bleach? 99.1%!!! They even did statistical tests to show that there is no difference in efficacy between the two part formulation and 50% bleach with a P value = 0.11.

So what can we take away from all this?

-50% bleach will destroy all nucleic acids on a surface within a minute

-bleach/bicarbonate pH 9.3 is equally effective, and is much less corrosive

– Adding SDS/emulsifier helps the already potent solution clean MORE BETTER by helping make better contact and removing organic load (Shmoo).

– Using a fragrance to hide the scent of bleach is a good idea, especially when that fragrance also keeps the SDS in solution

-If you must have all nucleic acids dead, DEAD, a solution of peroxide and copper will finish the job that your bleach didn’t.

– The authors don’t mention RNase activation, but looking at the previous patents this mixture would likely destroy most nucleases

So yeah, just throw some bleach on it, no worries.

Update: Here’s the decontamination solution recipe I’ve settled on. I use it on basically any surface I want to clean/decontaminate, watch out for your eyes though! It’ll burn them clear out of your eyeholes!

Decontamination Solution (v1.3)
10-15% Store bought bleach (100-150 mL/L)
1% NaOH (10 g/L)
1% Alconox/Sparkleen/dish soap (10 g/L) *
90 mM sodium bicarbonate (7.5 g/L) **

* Commercial versions use SDS, but at higher concentrations (=>1%) the SDS will tend to crash out. Unless you have the 2141-BG fragrance/emulsifier, either use a lower concentration of SDS (<0.1%) or use the above detergents *

** Sparkleen and Alconox have sodium bicarbonate already in it in high concentrations, up to ~40% for Alconox, so the addition of bicarbonate may not be necessary.

Assuming Sparkleen has 30% bicarbonate,  10 grams of sparkleen has 3 grams bicarbonate, which would make a final solution that has 36 mM bicarbonate, which could still provide corrosion inhibition, depends how strongly you want to believe the 90 mM from the DNAzap patent. **

*** This decon mix will corrode aluminum and iron/cheap stainless steel at high concentrations and when treating for long periods of time. Good quality stainless hold up fine. ***

**** This mix is awesome for cleaning glassware, let a beaker sit in 0.5X or 1X decon mix for a while, the longer the better. It will sparkle after you rinse it! The high NaOH content is reminiscent of base baths used by chemists to etch a nice clean layer on their glass. ****

本文来自:https://pipettejockey.com/2016/11/01/just-bleach-it/

Cas13: tips and tricks

CAS13 BASICS

DNA targeting CRISPR enzymes, such as Cas9 and Cas12a (formerly Cpf1), have enabled many new possibilities for manipulating and studying DNA. Recent computational efforts to identify new CRISPR systems uncovered a novel type of RNA targeting enzyme, Cas13. The diverse Cas13 family contains at least four known subtypes, including Cas13a (formerly C2c2), Cas13b, Cas13c, and Cas13d (Fig. 1a). We originally showed that Cas13a could programmatically bind and cleave RNA, protecting bacteria from RNA phages and serving as a powerful platform for RNA manipulation (Fig. 1b) (Abudayyeh*, Gootenberg*, Konermann* et al Science 2016), but further computational and biochemical exploration of Cas13 has led to an understanding of additional subtypes.

Figure_1.jpg

Figure 1. The Cas13 family. A. Four subtypes of CRISPR-Cas13 systems have been reported to date, which are classified based on the identity of the Cas13 protein and additional locus features. All known Cas13 family members contain two HEPN domains (shown in orange), which confer RNase activity. B. Cas13 can be reprogrammed to cleave a targeted ssRNA molecule through a short guide RNA with complementarity to the target sequence.

Cas13s function similarly to Cas9, using a ~64-nt guide RNA to encode target specificity. The Cas13 protein complexes with the guide RNA via recognition of a short hairpin in the crRNA, and target specificity is encoded by a 28 – 30-nt spacer that is complementary to the target region. In addition to programmable RNase activity, all Cas13s exhibit collateral activity after recognition and cleavage of a target transcript, leading to non-specific degradation of any nearby transcripts regardless of complementarity to the spacer.

It was hypothesized that this activity may be part of a programmed cell death pathway in bacteria, allowing cells to commit cell suicide or become dormant unless they recover from infection. Fortunately, the collateral activity is undetectable in mammalian cells and plants allowing for many RNA targeting applications to be developed using Cas13. Many applications have also been built using Cas13s in mammalian cells, including transcript knockdown, live-cell transcript imaging (Abudayyeh*, Gootenberg* et al., Nature 2017), and RNA base editing (Cox*, Gootenberg*, Abudayyeh* et al., Science 2017).

While Cas13a showed some activity for RNA knockdown, certain orthologs of Cas13b proved more stable and robust in mammalian cells for RNA knockdown and editing. More recently, additional orthologs of Cas13 have been discovered, including Cas13d, which has been leveraged for efficient and robust knockdown across many endogenous transcripts (Konermann et al., Cell 2018). Konermann et al. additionally showed that Cas13d can be used to modulate splicing of endogenous transcripts and that the coding sequence for Cas13d is small enough to fit within the packaging limits of AAV for in vivo delivery.

Beyond these in vivo activities, we and others realized that Cas13s non-specific RNase activity, could be leveraged to cleave fluorescent reporters upon target recognition, allowing for the design of sensitive and specific diagnostics using Cas13. We dubbed our specific detection system SHERLOCK (Gootenberg*, Abudayyeh* et al., Science 2017).

Below, we discuss tips and tricks for a variety of Cas13 applications, including knockdown, RNA editing, and SHERLOCK, and include a discussion about how to choose between the variety of Cas13 orthologs.

KNOCKDOWN WITH CAS13

One of the most straightforward applications of Cas13 in vivo is targeted RNA knockdown using mammalian codon optimized Cas13 and guide expression vectors. Knockdown of RNA (Fig. 2a) relies on cleavage of the targeted transcripts by the endogenous RNase activity of the dual HEPN domains of the protein, the efficiency of which varies between different orthologs and subtypes of Cas13 (see Table 1). As a result, guide design and restrictions on targeting depend on the system used.

Figure_2.jpg

Figure 2. Knockdown of target RNA molecules with Cas13

● Cas13 ortholog-specific guide restrictions
In the initial characterization of Cas13a (Abudayyeh*, Gootenberg*, Konermann* et al., Science 2016), the Cas13a from Leptotrichia shahii (LshCas13a) demonstrated a sequence constraint, termed the Protospacer Flanking Sequence (PFS), both in vitro as well as in bacterial cells. Immunization of E. coli against MS2 phage by heterologous expression of the LshCas13a system depended on the presence of a 3’ H (not G) base immediately flanking the protospacer sequence. Similar PFS restrictions have been observed in bacteria for Cas13b (Smargon*, Cox*, Pyzocha* et al., Molecular cell 2017;Cox*, Gootenberg*, Abudayyeh* et al., Science 2017). However, in mammalian cells, no PFS restriction has been documented for the Cas13 orthologs tested, including Cas13a, Cas13b, and Cas13d. Additional sequence-based rules for targeting with Cas13 in vivo will likely be deduced as the number of guides tested increases over time.

● Target restrictions due to RNA secondary structure

An additional factor that must be considered when targeting single-stranded RNA species in vivo is the accessibility of the target due to higher-order structures. In vitro, Cas13 cleaves near unstructured regions of the target RNA (Abudayyeh*, Gootenberg*, Konermann* et al., Science 2016), and in vivo, predicted secondary structure (i.e., double-stranded RNA) is negatively correlated with knockdown in bacteria or mammalian cells, as Cas13 requires a single-stranded substrate and likely lacks the helicase activity necessary for opening up double-stranded RNA regions for guide binding.

In bacteria, screening guides against E. coli essential genes with Cas13b revealed that spacers with secondary structure near the protospacer had reduced depletion in the screen (Smargon*, Cox*, Pyzocha* et al Molecular cell 2017). In mammalian cells, spacers tiled along the length of target transcripts resulted in greater knockdown of the transcript when targeted in regions of low secondary structure (Abudayyeh*, Gootenberg* et al., Nature 2017). Although these associations are not definitive, targeting regions with substantial base pairing may reduce the efficiency of knockdown. In both studies, the RNAplfold algorithm was used (Bernhart et al., 2006), although for ease of use online tools such as RNAfold can provide computational folding predictions. Additionally, the siRNA design tool RNAxs can be used for finding regions of a transcript that have good accessibility to narrow the target region space for designing crRNAs. Whether targeting accessible regions or not, we usually test 3-5 guides to find a highly efficient one (Fig. 2b). Future dedicated Cas13 design tools will streamline Cas13 knockdown experiments.

Table 1. Comparison of top Cas13 orthologs for RNA knockdown in mammalian cells.

Ortholog Organism Efficiency Reference
LwaCas13a Leptotrichia wadeii ~50% knockdown on luciferase and endogenous transcripts Abudayyeh et al. Cox et al.
RfxCas13d Ruminococcus flavefaciens 80-95% on mCherry reporter and endogenous transcripts Konermann et al.

● Differences in Cas13 subtype activity in different model systems
Beyond the above design guidelines, the many different Cas13 subtypes have varied activities in different model systems. Because of the variety of Cas13 subtypes and orthologs, selection of the right construct for knockdown can be difficult. While LwaCas13a, PspCas13, and RfxCas13d have all been demonstrated to achieve robust knockdown across numerous genes in mammalian cells, a comparison between Cas13a, Cas13b, and Cas13d indicated that RfxCas13d has the most robust and substantial knockdown in HEK293T cells (Konermann et al., Cell 2018). For plant applications, only LwaCas13a has been tested, where it achieved substantial knockdown in rice protoplasts.

RNA EDITING WITH CAS13 (REPAIR)

Another valuable application of RNA targeting is to guide RNA editing enzymes to transcripts for precise base editing. Using Cas13, we developed a programmable RNA editing system that allows for temporal modulation of genetic variants in transcripts. The system, called RNA Editing for Programmable A to I Replacement (REPAIR), works by fusing the adenosine deaminases acting on RNA (ADAR2) deaminase domain to Cas13b (Fig. 3a). Because the optimal substrate for RNA editing activity is a dsRNA template, we are able to direct ADAR2 activity via guide RNA duplex formation at the target site. Previous studies of ADAR function have shown that the deaminase activity is dependent on the duplex length and position of the targeted adenine within the duplex. While there are not strict guide design rules for REPAIR yet, we have found that generally 50-nt guides work better than longer guides (e.g., 70 or 84 nt in length). In some cases 30-nt guides work best, but as a general rule of thumb, 50-nt guides will provide the most robust editing efficiency.


Figure_3.jpg

Figure 3. RNA Editing with Cas13 (REPAIR).

In our initial work, it seemed as if putting the target base in the 34th nucleotide position would reliably provide the highest editing efficiency (Fig. 3b). In practice, it is best to test several different designs placing the base pair in positions 32-36 in order to find the optimal design for editing (Fig. 3c). Eventually, guide design tools based on large datasets of REPAIR targeting will allow for guide efficacy prediction and easier design.

● Choosing between REPAIRv1 and REPAIRv2

Our initial iteration of REPAIR, version 1 (REPAIRv1), had many off-targets due to its high activity and overexpression. We found that by generating mutants in the ADAR2 catalytic site, we could lower the off-targets by two orders of magnitude and still retain on-target editing (10%-40% editing) with REPAIRv2. As we find that REPAIRv2 does have lower efficiency editing, we find it more appropriate for settings where off-targets could be problematic. If off-targets are not of serious concern, we recommend using REPAIRv1 in order to achieve the highest possible editing rate, such as in most cell types, in vitro or in vivo, that do not show toxicity due to off target effects. In our own experiments, we have tested a handful of cell types that did not experience toxicity due to REPAIR off-targets.

More sensitive cell types such as embryonic stem cells, for example, may need a more delicate approach with REPAIRv2. An alternative approach for lowering the off-target rate is to decrease the expression of the Cas13-ADAR2 fusion while keeping guide expression high. This can be achieved by transfecting less plasmid, using ribonucleoprotein (RNP) complexes, or integrating the fusion into cells. Any of these approaches will lower the protein expression, substantially reducing off-target editing while maintaining high on-target editing.

NUCLEIC ACID DETECTION WITH CAS13 (SHERLOCK)

Beyond applications in cells, certain properties of Cas13 make it well suited for nucleic acid detection. When the enzyme recognizes its target in vitro, it becomes activated and promiscuously cleaves RNA species in solution. This promiscuous and rapid cleavage activity can be used to amplify the signal from as little as 100,000 molecules in solution, equivalent to a femtomolar concentration in a microliter sample. Cas13-based detection is specific, and can be tuned for single-nucleotide distinction at any position on the target.

To engineer an even more sensitive readout, Cas13 detection can be paired with an isothermal pre-amplification step, most commonly recombinase polymerase amplification (RPA), for a completely isothermal process, termed SHERLOCK (Specific High-Sensitivity Enzymatic Reporter unLOCKing) (Fig. 4a). The reaction can be performed either as a two-step reaction, with an RPA reaction followed by a step combining T7 RNA polymerase transcription and Cas13-based detection, or all enzymes can be run simultaneously in a one-pot reaction.

The most difficult part of preparing to run a Cas13-based detection reaction is purifying the Cas13 protein. Unlike in vivo CRISPR tools, the Cas13 protein must be recombinantly expressed and purified. The LwaCas13a protein vector for expression can be found on Addgene, and, if you are equipped with the necessary equipment for protein purification, you can follow our protocol here. Although the LwaCas13a protein is not currently available commercially, feel free to reach out to us for possible sources if you need help acquiring the protein.

When designing a Cas13-based detection experiment, it is common to design the crRNA for the ortholog of choice (typically LwaCas13a) as DNA, and then generate the RNA using an in vitro transcription reaction. Alternatively, guides can be ordered as synthetic RNA from providers such as IDT or Synthego, and we have seen increased performance with synthesized RNA.

When running an RPA pre-amplification, in the case of a complete SHERLOCK reaction, it’s also important to consider primer design to find the primer set with maximal amplification: we typically follow the TwistDx guidelines, and use NCBI Primer blast for primer design (Fig. 4b). Additionally, you must include a T7 RNA polymerase promoter on the forward primer. For maximal chance of success, we design two RPA primer sets and two crRNAs. In most cases, all combinations of the primer sets and crRNAs will work well, but one will have maximal signal and sensitivity.

Figure_4.jpg

Figure 4. Nucleic acid detection with SHERLOCK.

Additional design rules may apply when implementing other capabilities of SHERLOCK, such as single-nucleotide specificity. We find that we can increase the single-base distinction capabilities of Cas13 by adding an additional mismatch in the guide sequence (i.e., a “synthetic mismatch”) (Fig. 4c). By testing multiple locations, we determined that the optimal placement for the mismatch to be detected is in the third base of the spacer (near the direct repeat), and that the optimal placement for the “synthetic mismatch” was either in position 4 or 5 of the crRNA guide. When testing a mismatch sensitive guide design, we typically test both of these positions to determine the optimal crRNA for maximal distinction.

Recently, we developed additional advancements of the original SHERLOCK technology, including multiplexing using different Cas13 or Cas12 orthologs and lateral flow readout, providing an instrument-free option for point-of-care readouts. Any test can be adapted for lateral flow by purchasing lateral flow strips from providers such as Milenia Biotec, and switching out the fluorescent RNA reporter for a biotin-RNA-FITC reporter molecule. Plasmids for additional Cas13 orthologs for multiplexing can be obtained from Addgene, but, as with Cas13a, the recombinant protein must be purified.

Strategies for avoiding amplicon contamination in the molecular laboratory

Uracil N-Glycosylase (UNG)

To get a sense of the scope of this, consider a successful “average” 25μl PCR somehow getting opened and spilled in the lab. This would contain on the order of 10^12 template copies (amplicons); in other words, if a thorough cleaning reduced this by a million fold, you’d still have a million amplicon copies “floating around,” each of which could contaminate a reaction. If you’re fortunate enough to have never experienced this first-hand, you can thank the widespread acceptance of real-time PCR methods, which do away with having to open reaction tubes post amplification, and perhaps gain an appreciation of why anyone who has been through the experience treats the risk as real and ever-present.

Even real-time reaction tubes or plates can accidentally break open or get unsealed, so in many labs a second line of defense against amplicon contamination is used—Uracil-N-glycosylase, or UNG. Basically, this works by incorporating a small amount of UTP in the PCR master mixes alongside TTP and the other three usual nucleoside triphosphates. During amplification, a small number of these UTP substitute in for TTP, resulting in all amplicons having at least a few uradine nucleotides incorporated. To ensure that these cannot serve as template in a subsequent reaction, the (thermolabile) enzyme UNG can be added to all reactions, and a first step of the PCR thermocycle can be a brief incubation at around 37oC. At this temperature, the UNG finds and cuts out any uradines found. Since these should only occur in amplicon and not natural template, and the removal of the offending base blocks the contaminating molecule from acting as a successful PCR template, an “active decontamination” of the reaction has occurred as its first step. The following high temperature steps in the reaction deactivate the UNG so it doesn’t attack any newly formed amplicons.

Overall, the process is elegant and effective, but it’s not the only possible approach to the issue of preventing amplicon contamination. In this month’s installment of The Primer, we’ll quickly review what some of the other complementary tools and strategies to avoid amplicon contamination are, and how they work.

Layout and process flow

If it’s possible within the physical constraints of the molecular diagnostics laboratory, it’s extremely helpful to have dedicated rooms for master mix preparation, sample extraction, PCR reaction setup, and final amplification and any handling of amplicon. Supported by ancillary practices such as dedicated garb for the various spaces, unidirectional material flow (toward the amplification area, not away), and, ideally, air pressure gradients with lowest pressure in the amplification area, that can aid in insuring that when a reaction vessel leaks in the amplification space, the products aren’t readily introduced back into newly incoming samples, reagents, or reaction mixtures. While this may seem to be just common sense, not all laboratories (particularly, older ones not originally designed for molecular workflows) have the luxury of having this sort of layout. Where this level of compartmentalization isn’t feasible, the next best approach is perhaps the use of dedicated biosafety cabinets (BSCs) or even their smaller, benchtop PCR setup hood cousins as the individual subspaces.

Other measures that can assist in physical isolation include use of “sticky mats” on the floor at doorways between process regions, and expanded personal protective equipment (PPE) such as disposable single use hairnets, masks, and shoe covers. On the equipment side, physical anti-contamination barriers can include the use of plugged, aerosol-resistant tips for micropipettors (in this author’s opinion, best coupled with having micropipettors dedicated for use in each of the rooms/ processes discussed above).

Chemical and UV decontamination

The next line of defense against amplicon contamination is the cleaning of surfaces and instruments prior to (and after) use. It’s important to remember what we’re trying to clean up here—DNA—because some of the common cleaning and sterilization processes in the lab are effective at inactivating viable microbes but do little or nothing to render DNA non-amplifiable. Yes, I’m looking at you, autoclave—and your sidekick, 70 percent ethanol. For wiping down work surfaces, rather than the 70 percent EtOH, use household bleach. The hypochlorite anion (to use bleach’s formal name) attacks DNA strands, causing oxidative damage leading to strand breaks and probably other types of damage, such as creation of base adducts like 5-chlorocytidine which don’t effectively serve as a template for replication.

While the mechanism of action of bleach in rendering DNA non-amplifiable is likely multifactorial and a matter of debate in extant literature, some aspects of its action are well known. It’s generally effective at around a 1:10 dilution of consumer strength domestic bleach (which can vary by manufacturer, usually five percent to eight percent) in water; so the actual on-the-bench strength for efficacy is about 0.5 percent. Keep in mind that dilute bleach solutions decay, however, and should be regularly remade. How often will probably depend on how long you’re willing to let it sit on the treated surfaces before assuming they’re clean (more on that below), and what your risk tolerance is, but in general solutions should be freshly made anywhere from daily to weekly. Any older than that, and using it is probably mostly placebo effect. As for “how long,” its action is not instantaneous, so ideally surfaces should be allowed to sit for several minutes after treatment and before use; anything from five to 30 minutes is suggested in literature.

Dilute bleach is corrosive by nature, however, and not all work surfaces and instruments are amenable to being treated with it. Another DNA-destroying liquid comes in the form of 1.0N HCl (dilute hydrochloric acid). It can act by causing acid catalyzed depurination, randomly removing A and G bases from DNA and leaving “gaps” or chain breaks which can’t be amplified across. Dilute HCl is stable, so it doesn’t need to be made fresh all the time, and many materials which don’t take kindly to being bleached are unfazed by exposure to HCl at this strength. So why don’t we just use this all over the lab and forget about bleach? The answer is that the HCl is not nearly as effective. Longer exposure times are required, and if a surface is contaminated enough, some DNA may survive intact; one study showed that even with 2N HCl and five minutes exposure, some amplifiable copies of a 600 base pair test target were recoverable.1 For what are potentially lightly contaminated surfaces and where bleach is for some reason unacceptable, it does remain an option particularly if longer exposure, such as overnight soaking, can be contemplated.

UV light is another standard method in the MDx lab. It can render DNA non-amplifiable through the formation of cyclobutane pyrimidine dimers and, to a lesser extent, what’s known as the “6-4 photoproduct”; in either case, it’s the creation of covalent bonds between adjacent bases on a DNA strand that disrupts their ability to hydrogen-bond as needed to serve as a replication template. Sometimes entire rooms will be rigged with UV light sources, in which case safety precautions are essential to ensure that these can’t be on while people are inside, and sometimes they’re set up inside BSCs or PCR hoods. In each of these cases, it’s worth keeping in mind that they’re only effective where the light can reach; anything shadowed, or under a layer of protective grime, is unaffected.

Many things, including most plastics, don’t stand up well to prolonged strong UV exposure, becoming brittle and crumbly over time; this also applies to micropipettor shafts. In addition, the UV light sources decrease output over time and become less effective. Thus, even if those things spread out in your hood are not shadowed, and you’re OK with everything around them being bathed in a destructive UV glow, if that UV light source is of unknown age and hasn’t been tested, it may be little more than a spooky purple glow lulling you into a false sense of security.

In-reaction chemistries

Finally, we come back to things you can add into the reaction vessel—microtube, reaction plate, capillary, or whatever fits your PCR instrumentation. The most common approach here by far is the UNG method, but it’s not the only possible approach. Psoralen and isopsoralens are a class of molecules which can be added to a PCR reaction during setup, and which at suitably low concentrations—roughly, below 100mg/ml—don’t noticeably inhibit the PCR reaction. At the end of the reaction, and prior to opening any reaction tubes, exposure of the translucent reaction vessels to light causes the (iso)psoralen molecules to cross-link to any DNA present, including amplicon. If this crosslinked amplicon somehow escapes into the lab, the crosslinks block its capacity to act as an amplification template.

Aside from the fact that this requires an inconvenient UV light exposure for all reactions post-amplification, another disadvantage of this approach is that the inactivating chemistry doesn’t occur until after the amplification reaction. In other words, if somehow a reaction breaks or otherwise gets open after a successful amplification but before inactivation, you’re contaminated. (By contrast, as the UNG approach incorporates the uridines during each cycle of replication, breakage or leakage from a reaction at any point is not worrisome).

Common sense: putting these all together

The best defense against PCR contamination in your laboratory will be some combination of these approaches, as fits your lab’s physical layout, methods in use, resources, and requirements. What that particular combination is, is something readers may hopefully be better able to assess in their own context through a basic understanding of the approaches’ mechanisms of action, strengths, and weaknesses. A robust set of anti-contamination measures, coupled to ubiquitous negative control reactions (and possibly, as needed, scheduled environmental wipe/sample reactions) to detect any breakdowns in these defenses, can help protect your lab from the scourge of PCR contamination.

REFERENCE

Prince AM, Andrus L. PCR: how to kill unwanted DNA. Biotechniques. 1992;12(3):358-360.

Fischer M. Efficacy Assessment of Nucleic Acid Decontamination Reagents Used in Molecular Diagnostic Laboratories.PLoS One. 2016 Jul 13;11(7):e0159274.

https://www.luminexcorp.com/blog/10-ways-minimize-contamination-molecular-laboratory/


病毒载体注射动物的基本方法

供大家参考。

1. 尾静脉注射

1. 提取小鼠尾巴,将其放在鼠笼盖或者手背上,并进行适当的安抚;
2. 将小鼠装入固定器中,盖紧盖子,并使尾巴朝外露出用酒精棉球擦拭小鼠尾巴或者用热水、浴霸加热,使其血管扩张;
3. 将尾巴拉直,使其红色静脉清晰可见;
4. 距离鼠尾尖1/3处进针,若进针畅通无阻,则说明针头在血管内;
5. 检查针管内有无回血,如有,则可以注射;
6. 用棉球按压注射点1min左右进行止血;
7. 最后,将小鼠从固定器取下,放回鼠笼中。

补充说明

1. 大鼠尾静脉注射病毒量参考:文章“AAV9 supports wide-scale transduction of the CNS and TDP-43 disease modeling in adult rats”中给出:6周龄的年轻成年大鼠重约150g。文中AAV9 TDP-43 or AAV9 GFP, 一个典型的剂量是每kg大鼠给药3 x 10^13 – 1 x 10^14 v.g。确保体积不超过标准建议注射量体积(250克大鼠250-500μL)。对于年轻的成年大鼠,推荐的注射体积是200μl。
2. 小鼠尾静脉注射视频: http://www.taogene.com“动物注射”板块观看。

小鼠尾静脉注射示意图

tailvain.jpg

2. 颞/面静脉注射

1. 将一只幼崽直接放在湿冰上30-60秒,以麻醉动物。由于存在低温相关并发症(包括心室颤动,组织缺氧和代谢性酸中毒)的风险,请勿将动物置于冰上太久。文章中告知,30-60秒足以减缓小鼠运动以允许注射。如果需要更深的麻醉,吸入剂如1-2%的异氟烷可能是合适的;
2. 当动物在冰上时,向注射器中加入30μl伊文思蓝染料;
3. 当动物完全麻醉时(仍然呼吸但在冰上缺乏运动),在显微镜下移动它。对于右手注射,请将对着动物的枪口朝向右侧。将左手食指放在枪口上,左手中指放在耳塞尾部,使耳塞位于食指和中指之间;
4. 检查耳朵前方的毛细血管,当皮肤被操纵时会移动。毛细管并不是目标,而是识别颞/面静脉识别很重要。接下来,找到毛细管下方的暗阴影静脉,无论皮肤位置如何,毛细管都保持固定。颞静脉呈阴影状,向腹侧背侧,并进入颈静脉;
5. 进入颞静脉,针斜面向上。如果正确插入,可以通过皮肤观察针斜角填充血液。然后慢慢压下柱塞,注意静脉沿着脸部侧面漂白;
6. 让针头在静脉内保持10-15秒,以防止注射剂回流。

图A:临时注射平台;图B:手指位置;图C:注射位点

640.jpg

说明:更多注意事项请参考文章“Intravenous Injections in Neonatal Mice”。

3. 腹腔注射

1. 从笼中提取小鼠尾巴,并将其放在手背上,进行适当安抚;
2. 左手握小鼠,用拇指、食指捏住小鼠颈背部,用无名指及小指固定其尾和后肢,腹部向上,头呈低位;
3. 右手持注射器,插入小鼠腹部,注射部位为下腹部离腹白线约0.5cm 处,使针头与小鼠腹部约成 30°角刺入腹腔,针头刺入的速度要快,刚开始刺时会有一种明显的抵抗力,那是因为鼠皮具有韧性,后来突然会有一种抵抗力消失的感觉,说明针头已刺入腹腔内,此时回抽没有回血,说明针头没有进入脏器,就可以进行注射。(注意:针头刺入腹腔不宜超过 1cm,进针动作要轻柔,防止刺伤腹部器官);
4. 注射完病毒后,缓缓拔出针头,并轻微旋转针头,防止漏液;
5. 最后,将小鼠重新放回笼中,继续饲养观察。

小鼠腹腔注射示意图

说明:小鼠腹腔注射视频,www.taogene.com“动物注射”板块观看。
4. 视网膜下注射

1. 通过腹腔注射安乐死和唑拉西泮(1:1,2.25 mg / kg体重)和盐酸甲苯噻嗪(0.7 mg / kg体重)或替代品的混合物麻醉成年小鼠(即6-8周龄);
2. 用0.5%的去氧肾上腺素和0.5%的托吡卡胺滴眼液扩张瞳孔;
3. 准备已经加有1.5-2μl病毒微量注射器;
4. 为了方便注射,打开眼睑,使眼睛露出赤道(equator),并在手术显微镜下观察。保持眼睛露出赤道(equator)直到注射结束,防止在注射期间可能发生针的移位。将手指放在眼眶边缘外以便牢牢握住眼球;
5. 在角膜表面涂抹一滴眼用粘弹性溶液;
6. 在角膜顶部放置一个小圆形盖玻片,以显示视网膜;
7. 使用30 G 1/2无菌针头在角膜缘后面的一个小孔处穿孔进行进一步的视网膜下注射。为了方便,是孔位于右眼的下方,左眼的上方;
8. 将微量注射器的33 G钝针穿过预穿孔并进入视网膜下腔,直到感觉到轻度阻力的点为止;
9. 将病毒载体(比如1×10^6TU /μl)轻轻注入视网膜下空间而不发生震颤,以避免不必要的组织损伤,然后轻轻取出针头;
10. 在手术显微镜下注射后观察视网膜下水泡的形成,以确保视网膜没有出血;
11. 轻轻关闭眼睑以覆盖注射部位;
12. 将小鼠放回笼中,保证小鼠活力。

641.jpg
更多注意事项请参照文章“Limbal Approach-Subretinal Injection of Viral Vectors for Gene Therapy in Mice Retinal Pigment Epithelium”。

5. 脑立体定位注射

第一部分:实验前准备

脑立体定位仪,常规手术器械,颅骨钻,微量注射器,干棉球,1% 的戊巴比妥钠,生理盐水,1ml 注射器,小鼠 。
首先,用 1% 的戊巴比妥钠,以腹腔注射的方式麻醉小鼠,注射量为 80mg / 100g 小鼠 ;
然后,从饲养笼中取出小鼠 。5-10min 后,麻醉剂起效 。待小鼠麻醉后,用剃毛器将小鼠头部毛发剔除干净 。

第二部分:固定小鼠
将麻醉小鼠剔毛后的固定到立体定位仪上 ;
固定时,先将小鼠门齿卡在适配器门齿夹上,轻轻压上门齿夹横杆,调整适配器高度和前后,使耳杆可以方便进入小鼠外耳道;
左手托起小鼠头部,将左侧耳杆插入小鼠耳道,调节左右侧耳杆使动物头部保持在 U 型开口的中心位置,先锁紧固定一侧耳杆,后旋紧另一侧耳杆,使动物头部不能晃动,同时旋紧门齿夹螺丝;
检查是否固定成功:鼻对正中,头部不动,提尾不掉,目测大脑放置水平。用脱毛膏或者剃刀将需要手术部位的毛发去除。
然后用手术刀划开小鼠头部皮肤,去除颅骨表面结缔组织,暴露前后囟。
根据脑图谱,确定待注射脑区的位置参数,包含离 Bregma 和 Lambda 点的距离以及核团深度。以 Bregma 为 0 点,按照预先确定好的坐标移动颅骨钻,打开合适大小的骨窗(窗口尽量小但又不妨碍实验)。
小心地用颅骨钻在注射位点处轻磨颅骨,将颅骨慢慢打薄,当颅骨出现裂缝的时候,用医用注射器的针头小心挑破,防止损伤,如果在此过程中有出血,可以用很小的医药棉球拉成长条形将血吸走,钻孔时一定要控制好,否则很容易在钻通颅骨后一不小心钻头进入脑组织,造成损伤。

第三部分:注射病毒
用 PBS 冲洗微量注射器 ( 5μl 规格 ) 3-5 次;
先吸取 1μl 空气,再吸取 1μl 稀释好的病毒 ( 方便病毒充分注射进脑 ),在空气中测试注射器是否通畅;
将微量注射泵,微量注射器组装好,置于钻好的孔上方,针尖与颅骨平行 (Z=0),微调注射器位置使之与之前钻孔时位置相同。根据定好的深度将注射针缓慢下降。
6. 肌肉注射

1. 限制动物,确保动物的一条后腿自由并稳定注射。固定动物可能需要两个人。如果动物在注射期间可以动,则针头可能会导致肌肉损伤。动物固定方法可以参考文章“Manual Restraint and Common Compound Administration Routes in Mice and Rats”;
2. 针应垂直于动物皮肤插入。使用适当大小的注射器和针头,近似斜面的角度将针头插入,并将材料注入动物的股四头肌(大腿前部)或大腿外侧肌肉块。不要注入后部肌肉,因为它可能会损伤坐骨神经;
3. 如果动物要接受多次肌肉注射,交替腿进行注射。

7. 皮下注射

1. 限制动物自由,但是需要足够松散,保证皮肤能够移动;
2. 如果动物在皮下注射后要做常规处理,请不要使用颈背,此时可以使用背侧臀部或侧腹的皮肤。如果动物要接受多次皮下注射,则换其他部位进行注射;
3. 抓住皮肤,轻轻向上拉,形成“帐篷”形状;
4. 使用适当大小的注射器和针头,将针头以30-45°的角度插入拉起来的皮肤,然后注射。注射保持于拉起来皮肤的手指平行且尽量远离手指;
5. 如果注射成功,将会看到皮肤下的小肿胀。注射结束后,轻轻施加压力以防止回流。

说明:小鼠皮下注射视频手机登陆www.taogene.com进入资讯“动物注射”板块观看。
8. 皮内注射

1. 对于皮内注射,通常将动物剃毛以便可以看到皮肤;
2. 用于多次皮内注射的动物的约束可能是困难的。在这种情况下,化学镇静可能是必要的;
3. 将适当大小的针头以15-30°的角度插入皮肤。针头不要插入很远,注射遇到阻力即可。另一种方法是在注射部位附近轻轻捏住皮肤,并以非常小的角度插入针头。这在小鼠中很有用,因为它可以防止它们在注射过程中移动;
4. 如果注射成功,将会看到一个小疱。它会比周围的皮肤更苍白;
5. 注射后,轻轻施加压力以防止回流。

9. 灌胃

1. 只对受限制的清醒动物进行强效灌胃。麻醉或镇静会增加误吸的风险;
2. 选择使用适当大小的口服喂食针。这些针头的末端有球形尖端,以防止它们进入气管。所需的长度可以将受约束的动物保持向上然后从嘴角开始测量确定;
3. 约束动物,使其头部和身体呈直线垂直,这会使食道变直,使喂食针更容易通过;
4. 将针的球形尖端插入动物的嘴里,并在舌头上方。一旦针头到达正确位置,将针头和注射器向上,轻轻按压上颚,使动物的鼻子朝向天花板。在给大鼠进行胃内给药时,针可能需要在通过喉咙后部时稍微改变方向,如果感受到针上的任何张力都表明需要调整位置;
5. 继续将针送到预定位置。针应该很容易通过,动物不应该喘气或呛到,如果有阻力或动物喘息或者窒息,立即停止并取下针头。

说明:小鼠灌胃视频,www.taogene.com“动物注射”板块观看。
10. 鞘内注射

1. 剔除小鼠腰背部毛发,用75%酒精棉球消毒;
2. 将小鼠引诱至棉手套中,左手固定小鼠,暴露髂脊背部,右手持29 gauge注射针,待其安静后找到髂脊。ICR小鼠L5椎间隙几乎与髂脊平行,L6椎间隙距髂脊水平距离约为3 mm;C57BL/6小鼠L5椎间隙距髂脊水平距离约为1.5 mm,L6椎间隙距髂脊水平距离约为4 mm;
3. 以30°-45°角度插入中线皮肤,髂脊水平向尾部约3 mm处进针(ICR小鼠)或髂脊水平向尾部约4 mm处进针(C57BL/6小鼠),若针不能插入L6椎间隙,进针角度缓慢下调,同时沿着棘突和乳突间的凹槽向前移动针尖,直到插入L5椎间隙,针尖可以进入到椎管约5 mm位置;
4. 针尖进入椎管推入10 μL药液,小鼠尾巴颤抖或突然甩动则证明进针成功;

说明:此方法成熟稳定,无麻醉剂影响,不影响后续行为结果检测,对小鼠产生刺激较小,可尽量减小对实验结果的影响。
11.脊神经内注射

1. 健康小鼠在做脊神经结扎前1天禁食禁水;
2. 实验时,将小鼠背部毛发剔除,暴露出皮肤,用异氟烷呼吸麻醉;
3. 待小鼠进入麻醉状态后 ,用碘伏消毒后再用75%酒精棉球消毒,用11号刀片划开小鼠皮肤,具体位置为髂脊中线偏左。开口大小一厘米左右;
4. 接下来,在腰背部中线偏外侧划开,用弯镊沿脊柱方向钝性分离肌肉,暴露第六腰椎横突后,用棉球将横突周围血肉擦拭干净,使用尖镊钳断横突,暴露出神经,使用玻璃电极分离出第五腰神经,用6-0丝线结扎,使用微量注射器沿神经方向在神经外膜下进行注射;
5. 注射时注意速度缓慢匀速,随后剪去线头,将神经回复原位置,缝合肌肉,用碘伏消毒,最后缝上皮肤,再次消毒伤口;
6. 将小鼠放置温暖处待其苏醒。

注意事项:在手术过程中密切注意小鼠呼吸情况,防止小鼠呼吸过深死亡。

RNA-Seq中的核糖体清除技术

A Major Challenge in RNA-Seq

A major limitation encountered in RNA-Seq however is the massive abundance of ribosomal RNA (rRNA) that can occupy up to 90% of RNA-Seq reads.  This necessitates additional steps for ribo-depletion or rRNA depletion to economize an RNA-Seq experiment.

Ribo-Depletion Methods

1) Poly-A selection

The most common method of rRNA depletion is poly-A selection, which relies on the use of oligo (dT) primers attached to a solid support (e.g. magnetic beads) to isolate protein-coding polyadenylated RNA transcripts. The main disadvantage though is one misses out on non-polyadenylated transcripts which include microRNAs, small nucleolar RNAs (snoRNAs), some long non-coding RNAs (lncRNA), and even some protein-coding RNAs (histones) which lack polyA tails. As a result, one fails to capture biologically relevant insights on these RNAs which make up a substantial proportion of the transcriptome.

Poly-A Selection - Advantages and Disadvantages

Curiously, polyadenylated transcripts are more abundant in eukaryotes as opposed to prokaryotes with both groups using polyadenylation in entirely different ways! Hence, polyA selection cannot be applied for sequencing of bacteria and archaebacteria, excluding its use in metagenomic RNA-Seq.

Poly-A selection also relies on transcripts being largely intact and tend to over-represent 3′ regions of transcripts. Studies comparing physical rRNA depletion methods and polyA selection show polyA selection did not work well for degraded RNA samples. A lower number of reads were also obtained with formalin-fixed paraffin-embedded (FFPE) tissues though analysis of fresh frozen tissues was not compromised.

Despite this, polyA selection still provides greater exonic coverage than physical rRNA depletion which tend to produce more intronic reads.  Further, a lower sequencing depth is typically needed for polyA selection, making it a respectable choice if one is focused only on protein-coding genes.

2) Physical Ribosomal RNA (rRNA) removal

Ribosomal rRNA can also be removed by hybridization to complementary biotinylated oligo probes, followed by extraction with streptavidin-coated magnetic beads. riboPOOLs developed by siTOOLs Biotech efficiently removes rRNA through this route, with a workflow similar to Ribo-Zero from Illumina.

Physical rRNA removal workflow

Workflow for rRNA removal with biotinylated probes and streptavidin-coated magnetic beads

Compared to polyA selection methods, rRNA removal enables detection of non-polyadenylated transcripts and small RNAs.  Comparisons between differential gene expression detected with both methods were typically well-correlated. The rRNA removal method however could detect both long and short transcripts showing less of a 3′ bias than polyA selection.

Physical rRNA removal also performs better for degraded and FFPE samples, and can also be applied for metagenomic samples that contain microbes. The Pan-Prokaryote riboPOOL by siTOOLs for example, functions effectively to remove rRNA from a diverse range of prokaryotic species, and can be used in combination with human and mouse/rat riboPOOLs to deplete rRNA from complex samples containing multiple species.

Physical rRNA Removal - Advantages and Disadvantages

By using targeted probes, one can also flexibly deplete abundant RNAs that take up expensive RNA-Seq reads. For example, globin, found in high amounts in RNA isolated from blood samples, can be efficiently depleted by globin mRNA-specific probes.

Ribosomal RNA can also be removed by selective degradation where enzyme RNase H is used to specifically degrade DNA-RNA hybrids formed between DNA probes and complementary rRNA (e.g. NEBNext rRNA depletion kit by New England Biolabs). This method was reported to produce consistent results, working as well on degraded samples though there was a bias against detecting transcripts of shorter length compared to Ribo-Zero.

3) Targeted amplification

An alternative method to deplete rRNA involves the use of  “not so random” hexamer/heptamer primers with a decreased affinity for rRNA during first strand cDNA synthesis. This is employed by the Ovation RNA-Seq kits from NuGen. Though the kit can be used to detect non-polyA RNAs and can be applied to prokaryotes, the additional incorporation of oligo(dT) still contributes to a bias towards  detecting 3′ regions.

A recent ribosome profiling study comparing library preparation methods reported fewer reads obtained and greater intronic reads for Nugen kits compared to polyA-selection methods. As Nugen also incorporated an RNase-mediated degradation of unwanted transcripts during final library construction steps, this indicates targeted amplification alone cannot totally remove rRNA. The method does however work with low input amounts and degraded samples.

Targeted Amplification with not so random primers - Advantages and Disadvantages

So which ribo-depletion method works best?

And the answer as always? It depends. Depending on the ribo-depletion method chosen in RNA-Seq library preparation, some differences in genes detected and their expression levels will certainly be observed.

Poly-A selection might be the most efficient method when only focussed on protein-coding genes, but one loses significant information on non-polyadenylated RNAs and immature transcripts. In instances such as microbial sequencing or in sequencing degraded or FFPE samples, poly-A selection cannot even be applied or may perform poorly.

Physical rRNA removal offers the advantage of retrieving more transcriptomic information but comes at a cost of greater intronic/intergenic reads that necessitates a greater sequencing depth. However, it offers greater flexibility and better performance in sequencing of challenging sample types.

Targeted amplification with “not so random” primers though effective for low input material, comes also at a cost of greater sequencing depth required.

All methods are subject to some extent of non-specificity and detection bias. Further variability can also arise from different methods of sequence alignment in RNA-Seq data analysis. It is therefore always advisable to validate sequencing data obtained by real-time quantitative PCR (rtqPCR) or other methods.

References:

1. Song, Y., Milon, B., Ott, S., Zhao, X., Sadzewicz, L., Shetty, A., Boger, E. T., Tallon, L. J., Morell, R. J., Mahurkar, A., and Hertzano, R. (2018) A comparative analysis of library prep approaches for sequencing low input translatome samples. BMC Genomics. 19, 696
2. O’Neil, D., Glowatz, H., and Schlumpberger, M. (2013) Ribosomal RNA Depletion for Efficient Use of RNA-Seq Capacity. in Current Protocols in Molecular Biology, p. 4.19.1-4.19.8, John Wiley & Sons, Inc., Hoboken, NJ, USA, 103, 4.19.1-4.19.8
3. Stark, R., Grzelak, M., and Hadfield, J. (2019) RNA sequencing: the teenage years. Nat. Rev. Genet. 10.1038/s41576-019-0150-2
4. Cui, P., Lin, Q., Ding, F., Xin, C., Gong, W., Zhang, L., Geng, J., Zhang, B., Yu, X., Yang, J., Hu, S., and Yu, J. (2010) A comparison between ribo-minus RNA-sequencing and polyA-selected RNA-sequencing. Genomics. 96, 259–265
5. Zhao, S., Zhang, Y., Gamini, R., Zhang, B., and von Schack, D. (2018) Evaluation of two main RNA-seq approaches for gene quantification in clinical RNA sequencing: polyA+ selection versus rRNA depletion. Sci. Rep. 8, 4781
6. Herbert, Z. T., Kershner, J. P., Butty, V. L., Thimmapuram, J., Choudhari, S., Alekseyev, Y. O., Fan, J., Podnar, J. W., Wilcox, E., Gipson, J., Gillaspy, A., Jepsen, K., BonDurant, S. S., Morris, K., Berkeley, M., LeClerc, A., Simpson, S. D., Sommerville, G., Grimmett, L., Adams, M., and Levine, S. S. (2018) Cross-site comparison of ribosomal depletion kits for Illumina RNAseq library construction. BMC Genomics. 19, 199

RNA提取过程中的基因组DNA污染控制

Genomic DNA is often co-extracted with RNA and can serve as a template in downstream processes such as PCR. However, if your TaqMan® MGB probe spans an exon-exon junction, genomic DNA can be excluded as a template in a real-time PCR reaction.
In contrast, if both primers are designed within one exon, then genomic DNA could serve as a template for PCR amplification. In these cases, the user has to decide if the genomic DNA is sufficiently negligible.

RT reactions without reverse transcriptase (No RT controls) can be used to evaluate levels of genomic DNA in a RNA preparation. A No RT control is a reaction that has been prepared for reverse transcription (including RNA, dNTPs, buffer and so on) but no reverse transcriptase is added. One can estimate the amount of amplification in their samples that is attributable to genomic DNA templates by running No RT controls. For example, if a No RT control sample has a CT value 10 cycles higher than an RT test sample, then the No RT control sample started out with approximately 1000-fold less target sequence (assuming 100% efficiency, 1 CT ≈ 2-fold difference in initial template amount). Since the target template in this No RT control would exclusively be genomic DNA, one may conclude that 0.1% (1:1,000) of the amplification in the RT sample is attributable to the genomic DNA template. You will then have to determine if the PCR amplification attributable to the genomic DNA is sufficiently negligible compared to the amplification of the cDNA sequence.

via:

https://www.ncbi.nlm.nih.gov/pubmed/26545322

点击以访问 1125331_ABI_-_Guide_Relative_Quantification_using_realtime_PCR.pdf

https://www.ncbi.nlm.nih.gov/pmc/articles/PMC3281124/

从“死胡同”到绽放光彩——Cre-Lox神经遗传技术的20年

本文转自:https://zhuanlan.zhihu.com/p/26257864

撰文 | 钱卓 (美国奥古斯塔大学佐治亚医学院大脑与行为研究所所长、云南西双版纳生物医学研究院院长)

翻译 | 王德恒(云南西双版纳生物医学研究院大脑破译中心研究员)

一百多年前,西班牙神经解剖学家、1906年诺贝尔奖得主Ramón y Cajal在显微镜下观察到大脑不同神经元的微观结构,惊叹于各种脑神经细胞如同夜空闪烁的星星一样美丽。近代神经科学的新篇章由此开启[1]。

20世纪70、80年代,随着单细胞标记和膜片钳技术的出现,神经元结构与功能的研究得到了飞速的发展[3,4,5,7]。分子生物学技术也进一步把神经科学领域推到了更深层次的基因和蛋白质水平[8,9,10,11,12,13,14,15,16],大大推动了突触可塑性机理的研究[17,18]以及利用遗传工程技术增强大脑学习记忆和认知功能的研究[19,20]。

20世纪80年代后期和90年代初,在Mario Capecchi, Oliver Smithies和Martin Evan三位先驱基因打靶和胚胎干细胞技术(该工作使他们在2007年共享诺贝尔生理学或医学奖)工作的基础上[21],几个著名的实验室开始尝试创建突变小鼠用于基因在发育、肿瘤和免疫方面的功能研究[23,24,25]。随后,Alcino Silva, Seth Grant和Thomas O’Dell利用基因的敲除技术来研究CaMKII或Fyn蛋白激酶在突触和记忆功能 [26,27,28]。这些工作为基因和大脑功能的研究开辟了新的思路。然而,大家很快发现,许多全身基因打靶(基因在单个受精卵时就被敲除)构建的小鼠模型,由于遗传补偿缺少表型,或由于被敲除的基因在许多器官发育中的重要作用,发生了产后夭折或发育不良的情况。比如,在CaMKII基因敲除的小鼠身上,人们观察到了自发性的癫痫症状,而在Fyn基因敲除的小鼠中,大脑海马中的齿状回明显存在神经发育缺陷。这两种情况立即引起了关于如何解释模式小鼠脑功能缺陷的激烈争论:到底是先天发育缺陷,还是该基因在成年大脑思维过程中的调节作用,引起了小鼠的学习记忆功能下降?鉴于NMDA受体在可塑性中的关键作用,麻省理工学院的李育庆等人[29] 着手去证明其在学习行为上的开关作用,但是他们发现NMDAR1基因敲除的新生幼鼠由于大脑发育的缺陷(如吸吮反射的缺失),出生15小时后就全部死亡了。这些夭折的小鼠丘脑的固有触须桶状结构(stereotypic whisker barrels)没有形成,说明了NMDA受体在脑结构发育中的关键作用[29],对发育神经科学家来说,是一个令人兴奋的发现。相反,这样的结果对于认知和行为神经科学家来说,却是令人失望的,他们无法利用全身基因敲除技术来研究成年大脑的思维活动与神经机理。大家渴望能有一种新的遗传工程技术,不仅能避开发育过程,而且还能把任何一个基因只在特定的脑区的某一类细胞中进行条件性删除。

年轻而喜欢冒险的岁月

我对研发新一代遗传工程技术的兴趣起源于1990-1993年在哥伦比亚大学的那段经历。1990年,我从明尼苏达大学博士毕业,来到Eric Kandel(2000年诺贝尔生理学或医学奖得主)实验室作博士后。密歇根大学Bernie Agranoff教授曾在1964提出长时记忆需要新的蛋白质合成和基因表达。因为我看了一本描述Kandel在海兔研究中“争斗内幕”的科普书(Explorers of the Black Box: The Search for the cellular Basis of Memory),我在Kandel实验室主动避免用海兔做研究,而是选择大鼠为研究对象,寻找并克隆能被大脑活动所调节的基因。在我之前,Kandel两个极为优秀的博士后(在其他实验室读博期间就已发过一两篇Cell文章)由于技术原因,都徒劳而归。1990到1993年,我利用蛋白抑制所引进的即早基因“超表达”的现象,首次成功地差异克隆了一批被大脑活动所调节的新基因,包括大脑特异的即早基因BAD1 (Brain Activity-Dependent)、组织型纤溶酶原激活剂(tPA)和一种促细胞分裂的原活化蛋白激酶磷酸酶[30,31]。后来, BAD1基因也被约翰霍普金斯大学的Paul Worley实验室分离并另命名为Arc (Activity-regulated cDNA)[32]。对我来说,分离出大脑新的基因固然令人兴奋,如何检测这些基因在脑认知记忆中的功能更是一个巨大的挑战。大家已经知道基于反义寡核苷酸的“knock-down”方法既不精确也不可靠,而全身基因敲除看似是个不错的选择,但也有如上所说的局限性。

后来,我偶然发现杜邦公司的Brian Sauer博士的一篇论文报道了Cre重组酶在哺乳动物培养细胞株中对环形质粒转染时成功切除标记基因的现象[33]。该文在结语提出了一个很重要的问题:“不知Cre是否也能引起哺乳动物细胞染色体上内在基因的lox位点重组?” 这引发了我尝试用它来开发脑区和细胞类型特异性的基因敲除和/或转基因过表达新技术的念头。我知道,所有的教科书和文献描述DNA复制和重组与细胞分裂密切相关(如减数分裂或有丝分裂; 图1)。这个基本的学说深深地印在每个人的脑中,从Sauer的论文开篇句不难看出,他也对此深信不疑:“近年来,有丝分裂期的哺乳动物的细胞DNA重组的控制过程已成研究的热点……有丝分裂重组在免疫系统的发育和功能中起着核心作用。” 当时大家都知道大脑的神经元在出生后就不再进行有丝分裂(除了嗅球和海马体中的齿状回)。因此,任何人打算在成年大脑上进行DNA重组的工作,也意味着其科研生涯必将走入死胡同。大自然已经明确表明,所有的脑肿瘤都不是发生在神经元,而是在还能分裂的胶质细胞。因此,要想利用DNA重组的方式在大脑中进行区域和神经细胞特异性基因敲除显然是不可行的。

►图1

但我很想弄明白大脑基因的功能,只是当时只有少数的实验室拥有用来制作传统基因敲除小鼠的基因打靶设施和胚胎干细胞。因此我放弃了申请大学Faculty(教职)的机会(那时大家一般只做一个博后),而联系了犹他州的Mario Capecchi和麻省理工学院的Susumu Tonegawa两位大师,表达了想做第二个博后的愿望。高兴的是他们都同意了。于是,我去向Kandel寻求指导和建议,他建议我去Tonegawa的实验室,这让我有些诧异(Tonegawa因发现免疫抗体多样性的遗传机理在1987年诺贝尔生理学或医学奖,然后转行闯入了Kandel所在的学习记忆领域这一地盘,因此他俩关系很僵)。我也取得了Kandel实验室另一博士后Mark Mayford的同意使用他克隆的CaMKII启动子,该启动子将在小鼠出生2到3周后激活并只在前脑的主要细胞如锥体细胞上表达[34]。对于Kandel的指点和Mayford的慷慨我万分感动。直到数年后Mayford喝了酒后才偷偷地告诉我,原来Kandel当时看中了我的想法会注定失败,正好来个一石二鸟,为消耗掉一个现在的和一个将来可能的竞争对手,“绅士般”地顺水推了这一舟。

1993年秋天,我来到麻省理工学院。在我向Tonegawa做了只有15秒的简短介绍后(大名人们都太忙了),免疫专家的他并没有对我想研发的Cre-loxP神经遗传技术有什么看法,而是放任自由。我惊讶地发现这个有40个博后和学生的大实验室弥漫着丛林动物生存法则的氛围。不过总的来说,麻省理工学院还是一个非常令人兴奋的地方。

开发Cre-loxP神经遗传技术,面临着三大风险:

(1)当时的教科书中认为,DNA重组只能发生在分裂细胞中,而我的直觉是,疱疹病毒(引起唇疱疹)感染外周神经节并以某种方式进行自身复制(迄今为止,该机制仍然是未知的),而神经节的神经元“可能”没有分裂;

(2)实验的周期长而且程序复杂,两年内没有反馈,何况这是第二个博士后,哪怕在原理上能成立,如果在技术上出了差错,我仍将求职困难。我必须构建一系列质粒并创建出至少三种不同的小鼠品系,然后着手开始多年的交叉繁殖工作(图2A,B)。在那个年代,能够得到一只基因突变的小鼠,已属非常难得。事实上,因为复杂的程序、冗长的项目周期和昂贵的成本,再加上得到的可能是没有任何表型或非己想要的结果,学术界的一个残酷现实就是只有少数几个成功的人能得到一份大学的教授工作,另一大批没有成果的、不幸的博士后们只能从学术界消失。

(3)我给自己挖的另一个坑是:我选择NMDAR1而不是BAD1/Arc作为条件性敲除的基因。我们知道,如果在插入LoxP的位点在某种方式上干扰了NMDA受体的表达,那么数年后得到的将是生下就夭折的小鼠[29]。相反,如果在LoxP插入位点时,无意中把Arc基因弄坏,至少我还能发表一篇全身基因敲除的文章。但是我说服了自己,相信自己的想法不仅有希望,而且还能得到好结果:不成功,便成仁,到时,我也会因不相信教科书的教义,而得到一枚“荣誉傻瓜勋章”。

►图2

真正开始实验时,亟需把纷繁而又复杂的事项进行合理的安排。刚到新的实验室,一切还没理顺,幸好身边的几个同事都很友好,都愿意帮忙。David Gerber和Toshikuni Sasaoka分别教我受精卵和囊胚的微注射;陈东风在免疫抗体和染色方面给予指导;李育庆(现在佛罗里达大学任教)分享他对NMDAR1质粒构建的见解;徐明(现在芝加哥大学任教)为我提供胚胎干细胞并教我如何进行完美的胚胎干细胞培养;同时我也非常感谢加州理工学院的David Anderson提供的LacZ报告基因和杜邦的Brian Saucer提供的Cre-loxP质粒。

1994年初,我完成了所有的质粒构建并开始转基因小鼠的繁育和floxed NR1胚胎干细胞打靶。更幸运的是,我还有一个勤奋的本科生Cindy Tom和技术员Jason Derwon协助进行基因分型和脑组织切片的工作。

7月,德国的Klaus Rajewsky在Science上报道了他们在T细胞的RNA聚合酶中取得了50%的敲降[35],一团黑云飘到了我的头顶。因为这意味着,即使在分裂的T细胞中Cre重组的效率也不高:或是50%的T细胞可以100%敲除RNA聚合酶,或100%的细胞只删除一个基因的拷贝,或更糟的是,两种情况相互混合。尽管如此,我仍“奢望”(在进一步的文献搜索后)他们使用的瞬时激活启动子可能是T细胞发育过程中的Cre重组效率低下的罪魁祸首。在随后的岁月里,我把自己变成了鸵鸟,不顾外界的情况,一头扎进了我的Cre-loxP神经技术研发的沙堆里。

当年的深秋,我终于从实验中第一次得到了反馈。

在一个阳光明媚但寒冷的早晨,我仍然记得在显微镜下,我看见 LacZ大脑染色切片时的那种无法言喻的惊喜,在第一条的 Cre 转基因品系小鼠大脑中,我就发现海马CA1区锥体细胞中发生了特异的基因重组 (图 2)。因为海马 CA1区 是许多可塑性和记忆研究者眼中的“宇宙中心”,这样的好运使我坚信上帝不仅存在,而且一直就在我的身旁。随后,另外的几个 Cre品系也确认了类似 CA1区域特异性的重组;然后其他的Cre品系小鼠还显示具有前脑的特异性。当Tonegawa从日本出差回来,我向他汇报了我的发现。可能由于他在倒时差的缘故,他也没有想起我这几年在做的是什么课题。当他醒悟过来后,非常兴奋,立即打电话给加州大学洛杉矶分校的Alcino Silva(把Tonegawa引入神经领域的第一个博后,已成为该校的助理教授),与对方分享了这一惊喜。

与此同时,我在思考为什么本来应该在前脑表达而不是CA1区特异性的CaMKII 启动子会有如此的特异性作用。陈东风和我通过对Cre的染色找到了原因——我们发现 Cre在CA1区锥体细胞上的表达更高,因此基因顺利而有效地重组了。在之后的6到8个月的时间里,我通过交杂Cre转基因T29-1品系获得了floxed NR1纯合子小鼠,确认了CA1区锥体细胞特异性 NMDA 受体敲除。拿到3-5周的小鼠,Pato Huerta和我就各自推进脑片记录和组织学实验。我们亦留出一组小鼠与Tom McHugh, Kenny Blum和Matthew Wilson进行合作研究,在NR1突变小鼠上记录海马位置细胞的放电活动模式。现在,我们知道T29-1的Cre-lox重组在出生两个月的小鼠上保留了CA1区特异性,不过随着Cre表达时间的积累,如同预期的CaMKII启动子的动态,大概在小鼠出生第8周后开始,特异性重组将逐步扩散之整个前脑。

1996年的秋天,我们准备给Cell杂志投3篇连续的文章。我们决定将报告Cre-lox神经遗传技术的可行性作为第一篇,CA1区特异性NMDA受体敲除研究作为第二篇,位置细胞的特性作为第三篇。因为在工作中使用了Kandel实验室的CaMKII启动子,最初和Eric Kandel商议的是,Cre-lox的工作万一成功,我们将把他和Mark Mayford放在第一篇投稿中, 作为共同作者。这个起初不被看好的项目, 如今得到了出乎意料好的实验结果,也因此带来了诸多烦恼,令人头痛。Kandel认为神经科学界对CA1特异性的NMDA受体敲除在学习和记忆研究具有更为重要而广泛的意义,他要求将他的署名从第一篇的方法论文章中移到第二篇,但是Tonegawa也认为第二篇文章可能更重要,坚决反对。一个多月来来回回的争吵让我夹在中间左右为难,头痛不堪,但也让我亲身体验了什么叫做脑袋被挤夹在石缝里。最终Kandel的名字还是被Tonegawa硬放到了第一篇文章里,而最终这三篇连续文章在没有通讯作者的情况下,与1996年的12月底发表在了Cell杂志上[36,37,38](第一篇引用次数为921,第二篇为1526,第三篇514)。

神经科学的Cre-driver资源

Cre-lox神经遗传技术可行性的成功验证在神经科学领域引发了一个新的热点。我也于1997年夏天在普林斯顿大学分子生物学系建立了自己的实验室(施一公几个月后也来到来该系,我们成为系里仅有的两位华人教授)。美国国立卫生研究院意识到Cre-lox神经遗传技术对神经科学的独特而重要的作用,启动了神经科学研究蓝图Cre-driver (Cre-表达体系)项目,为认知行为学创建一批小鼠品系,以便更好地鉴定特定的细胞类型和神经回路的功能。我也在立项、评审过程中提供了一些指南和建议(我回避了申请,而专注创构转基因“聪明鼠”, [39])。美国国立卫生研究院最终遴选了三个中心,启动了神经系统表达Cre重组酶的转基因小鼠的创建及繁殖工作。三个研究中心分别由贝勒医学院的Ronald Davis博士(现在佛罗里达州Scripps研究所),冷泉港实验室的Z. Joshua Huang博士(与Brandeis大学的Sacha Nelson一起)和Scripps研究所的Ulrich Mueller博士领导。这几个项目创建了数百条Cre-driver的小鼠品系[40]。现在,这些品系的小鼠获得的途径有突变小鼠区域资源中心(MMRRC)或美国最大的动物供应商Jackson实验室的Cre库(见表1)。

美国国立卫生研究院的神经科学研究蓝图还资助了洛克菲勒大学的GENSAT项目。该项目由Nathaniel Heintz领导,创建BAC-Cre重组酶驱动的小鼠品系[41]。现今,已经创建了总计288个Cre品系。除了官方的努力,许多个人实验室和科研院校也创建了多种Cre-drivers[42,43]。迄今为止,Jackson实验室已经收集了600多个Cre品系的小鼠模型,提供给大家研究。

欧盟也跟随美国国立卫生研究院的倡议推出以CREATE命名的Cre-driver项目(为等位基因突变小鼠条件表达的资源协调)(表1)。CREATE联盟代表的大多数欧洲、国际小鼠数据库持有人以及研究团体的核心,建立Cre-driver品系的一体化战略,并应用在小鼠上建模来研究复杂的人类疾病。各国的研究人员可以通过联系EMMA (European Mouse Mutant Archive, Italy) 或者 MSR(International Mouse Strain Resource; Table 1)来获得Cre的不同品系。另外,英国、加拿大和日本也启功和资助了他们自己的Cre-driver项目(表1)。

►表1

脑研究的一个重要通用平台

在过去的十年中,Cre重组基因技术应用最令人激动的一个方向是采用光刺激操纵神经元的光遗传学[44,45]。研究人员通过在丰富的Cre品系小鼠上或Cre病毒表达光感应离子通道,刺激或抑制某类神经细胞的放电,使其成为耀眼的明星(这一系统被Karl Deisseroth简称为光遗传学)。亲眼看到光感应离子通道能充分地利用Cre重组基因技术的原理及这些Cre品系动物[46],为神经科学界更多的同行服务,对我来说是个莫大的乐趣。

在神经科学方面,并非仅有表达光感应离子通道受益于Cre-LoxP神经遗传技术这一平台。Cre-LoxP神经遗传技术在化学遗传学中已显现出强大作用,使得科学家能够激活或抑制特定的神经元。例如,在化学–转基因修饰过的蛋白上进行过表达,如蛋白激酶[47,48]或在特定的神经元或脑区设计药物激活专门受体[49]。研究人员还可以通过Cre品系使用floxed白喉毒素片段A(DTA)来删除(毒死)特定的细胞,然后观察所产生的表型。

此外,Cre-lox遗传技术也应用于逆行病毒对大脑各种神经元的示踪,如斯坦福大学骆利群教授等小组示踪锥体细胞或多巴胺细胞[50,51],或被用在透明大脑(Clarity)特异神经元环路的示踪方法中。哈佛大学的Jeff Lichtman和Joshua Sanes还巧妙地利用Cre-loxP系统的独特性质在单个神经元中,随机表达不同比例的红、绿、蓝色的绿色荧光蛋白(GFP)的衍生物,这种技术被称为“脑彩虹”[52]。这种技术使他们能够以一种独特的颜色标记每一个神经元,对神经科学连接组学领域来说,无疑是巨大的贡献。

Cre-lox遗传技术平台也被用于电压敏感的蛋白质来监测神经元的活动变化。基因编码的钙传感器,如GCaMPs,使得许多实验室通过对钙的瞬态来推断神经元活动的变化[53]。研究人员也在开发其他基因编码的电压敏感的荧光蛋白,以便可以离体或在体的方式来研究神经元的放电反应[54,2,6]。

去年,Stuart Ibsen和Sreekanth Chalasani报道了一个有趣的方法,采用低压超声刺激产生的微气泡可以增强机械的形变,从而激活力传导通道(TRP-4)促发神经元放电[22]。作者发现,通过在特定的神经元中过表达TRP-4,可以增强神经元对超声刺激的敏感性。另外,科研人员还报道了另一种非侵入性的方法:磁遗传学(magnetogenetics),可以通过磁刺激在体激活神经元。比如,神经元的激活是可由表达并刺激阳离子通道(TRPV4)与顺磁性铁蛋白的混合体来实现[55,56]。或外源磁受体铁硫簇组装蛋白1(Isca1)[57,58]。可以想象,随着各种新蛋白功能的开发,脑科学家们可利用Cre-lox技术平台,利用它们操纵特定的神经元,进一步了解大脑的工作原理。

回首过去的20年,研发Cre-lox神经遗传技术曾被同行断定为是一条死胡同,但凭着直觉和初生牛犊不怕虎的冲劲,我用头撞穿了“南山”,幸运地闯出了一条生路。如今在神经科学领域,几乎每周都会有科研人员利用Cre技术的学术成果报道。当学生们问起时,我会感慨地鼓励大家:年轻时当个愣头青,说不定就是上帝给你的一大宝器!

本文来自:Tsien JZ (2016) Cre-Lox Neurogenetics: 20 Years of Versatile Applications in Brain Research and Counting… Front. Genet. 7:19. doi: 10.3389/fgene.2016.00019

https://www.frontiersin.org/articles/10.3389/fgene.2016.00019/full

Proximity-CLIP — close encounters of the RNA kind

“Proximity-CLIP can be used to simultaneously map the compartment-specific landscape of RBPs, the transcriptome and RBP-occupied RNA loci”

41592_2018_220_Fig1_HTML.png

The spatial compartmentalization of RNA is pivotal to gene expression and its regulation. However, the study of RNA localization has been hampered by a lack of high-throughput methods for mapping the transcriptomes of different cellular compartments. A new method called Proximity-CLIP combines proximity-labelling of proteins with ultraviolet (UV) crosslinking and next-generation sequencing to map the subcellular locations of RNAs.

The team built on the previously established APEX-RIP, a technique for the high-throughput mapping of RNA localization in intact cells that combines compartment-specific protein biotinylation with protein–RNA formaldehyde crosslinking. The engineered peroxidase APEX2 functions as a labelling tag that is genetically targeted to subcellular compartments through fusion with compartment-specific localization signals. Addition of biotin-phenol, a small-molecule substrate for APEX2, results in the biotinylation of endogenous proteins in close proximity to the enzyme. Proteins can subsequently be identified by mass spectrometry, whereas crosslinked RNAs can be identified by RNA sequencing (RNA-seq).

In Proximity-CLIP, RNAs are first labelled with 4-thiouridine (4SU) in living cells that express specifically localized APEX2. RNA and proteins are crosslinked in vivo by UV light, rather than by chemical crosslinking, during the quenching step that follows the biotinylation of APEX2-proximate proteins. Localized, biotinylated and crosslinked ribonucleoprotein complexes are then isolated using streptavidin affinity chromatography. While the proteome is determined using mass spectrometry, the RNA can either be analysed by standard RNA-seq to identify local transcripts or undergo RNase treatment to reveal RNase-resistant ‘footprints’, which reveal the occupancy of these sequences by RNA-binding proteins (RBPs). Sequencing of cDNA libraries generated from footprints enables the identification and quantification of RBP-occupied cis-acting regulatory elements on transcripts.

The UV crosslinking of RNA labelled with 4SU leads to a T-to-C mutation in the corresponding cDNA libraries. This mutation can be exploited to bioinformatically remove contaminating RNAs that bind nonspecifically to the affinity chromatography matrix, thereby increasing the specificity of Proximity-CLIP. UV crosslinking also avoids some pitfalls of formaldehyde crosslinking, such as the crosslinking of long-range or indirect interactions.

Applying their technique to HEK293 cells inducibly expressing APEX2 fused either to a nuclear export signal or to histone H2B, Benhalevy et al. determined both the proteome and transcriptome of the cytoplasm and nucleus, respectively. Functional enrichment analysis showed that proteins biotinylated by H2B-APEX2 were involved in transcription or belonged to nuclear categories, such as ‘nucleus’ and ‘nucleoplasm’. Moreover, the protein profiles resembled those previously reported in a study that used mass spectrometry to determine nuclear and cytoplasmic proteomes.

Transcriptome profiles of the cytoplasmic and nuclear compartments obtained using Proximity-CLIP matched RNA profiles obtained after biochemical fractionation. Furthermore, sequencing of RBP-protected fragments from both nucleus and cytoplasm revealed a footprint profile that reflected each compartment; that is, the vast majority of RBP footprints on mRNA in the cytoplasm were found on mature mRNA, whereas 43% of mRNA footprints in the nucleus resided in introns.

Taken together, Proximity-CLIP can be used to simultaneously map the compartment-specific landscape of RBPs, the transcriptome and RBP-occupied RNA loci. Its high throughput compared with imaging-based techniques makes it particularly appealing for identifying the subcellular localization of transcripts and potentially interacting RBPs.

【REF】

Benhalevy, D. et al. Proximity-CLIP provides a snapshot of protein-occupied RNA elements in subcellular compartments. Nat. Methods 15, 1074–1082 (2018)

Koch L. Proximity-CLIP – close encounters of the RNA kind. Nat Rev Genet. 2019 Feb;20(2):68-69

Lifting the Curtain: a Beginners Guide to iPS Cell Culture

I think it is fair to say that most people who have experience with cell culture know that there is at least some degree of “black magic” that goes into getting a particular protocol to work. In my experience, I’ve found this to be especially the case with iPS/ hES cell culture. In this series of blog posts I hope to shed a little light on this “black magic,” to talk about what I’ve found works, and hopefully to generate a platform for others to share their secrets as well.

Even though iPS cell culture is a relatively new technology, there are already tons of protocols for culturing them—each with its own variations on the amounts of reagents to add to culture media, methods of passaging, ways of freezing down lines, and the list goes on. Clearly, there are countless variables to test if you want to optimize your culture strategy. In addition, however, I have found that not only are there variables in technique, there are also lots of differences in iPS lines, even when they are all reprogrammed from normal patients. These differences may be illuminated in ways like pluripotency tests, where one line may take exactly six weeks to form a clear teratoma while another line may not exhibit tumors until 10 to 12 weeks. This might not sound too surprising on paper, but when you have injected a couple different lines on the same day and six weeks down the road all your lines except for one have teratomas, it is easy to think that that last line just didn’t work. If you wait another couple weeks, you may be surprised to find a cage full of mice with teratomas. Also, differences in lines may become very obvious while trying to differentiate iPS cells down a particular lineage. Currently I have been working on driving cells down the hematpoietic lineage, and I’ve found that the culture conditions for differentiating one line are quite different from differentiating another line. Even variables as small as the line’s growth rate or passaging timing may be different. My point with all this is simply that you should be aware that these differences exist and to be open-minded if your experiences with one line do not translate 100% to those with another line.

So, moving on to the good stuff—how to deal with some of these variables. I’m going to give you the “Dummies” edition of what specifically I have found to work well culturing my cells.

iMEFs vs. Matrigel
There are two main ways to culture iPS cells: you can culture them on a feeder layer using irradiated mouse embryonic fibroblasts (iMEF), or you can culture them feeder free. Depending on your desired application, both methods have their benefits.

Here is the breakdown of what I have found using iMEFs.

iMEFs are really great if you are thawing a line you’ve never worked with before. They are reliable in culture for a good 10 days, which should give you enough time to see a couple small colonies form. Also, the iPS colonies formed on the iMEFs will be nice and uniformly shaped, so you will be able to clearly identify where your colonies are and where differentiation (if any) is occurring. However, there are a couple things that must be taken into account using iMEFs. First, you must use good-quality iMEFs. If they are not high quality, they will not provide the appropriate feeder layer and support that your iPS colonies need, resulting in failure to seed or improper seeding that leads to differentiation. You want your colonies to fit fairly snugly between the iMEFs so that they can stay contained and undifferentiated. However, if they are too snug (the iMEFs are plated too densely), the colonies will grow vertically and risk differentiating on account of not having the space to expand horizontally. I’ve used both homemade and purchased iMEFs and have found for my needs it is more cost effective to buy them. I get them from global stem (cat # CF-1 MEF), and it costs $24 for a vial of 2M cells. I plate them at 200k/well of a six-well plate and do this by splitting one iMEF vial over 10 six-well plate wells (ie: 1 and 2/3 plates). I’ve tried plating anywhere from 100K to 300k, and 300k was definitely way too much, but 100k was a bit too sparse for my iPS cells to seed well. Making sure they are evenly spread out over the plate is also really important, so be sure to do the “T” motion at least three times in the hood and then at least one more time in the incubator. My only comment about the homemade iMEFs is that, unless you are making them to share with many others (and therefore can take turns harvesting, irradiating, and preparing them), it’s a lot of work and may not necessarily save you that much money. The main downside to using iMEFs is that it’s a much more time-consuming process. In order to passage or seed iPS cells onto them, first you would need to gelatin-coat your plates, which will take a minimum of four hours to set. Then you can plate your iMEFs, but those need to sit overnight in order to plate properly. Ultimately, then, this means that preparing your plate needs to start one or two days before you want to plate your iPS cells on it.

Feeder free, on the other hand, is very quick to prepare, taking only one to two hours to set. The main products on the market right now for this are Matrigel (BD), CELLstart (Invitrogen), and Vitronectin XF (Stem Cell Technologies). I have only tired Matrigel, but from the descriptions of CELLstart and Vitronectin, they sound very similar. Another benefit of using one of these feeder-free systems is that they are quite a bit more streamlined and simple. The media usually comes as part of a kit, where you only have to add a couple of things (if anything) in. There is usually some sort of standardization with these systems allowing you to purchase not only your media but also a recommended passaging reagent and freezing reagent, which can be nice as well. My last comment about working feeder free is to make sure you are buying the hES-grade material. The first time I ordered Matrigel, I didn’t realize that there were differences in grade and purchased a non-ES cell-grade one. After about six days in culture, the Matrigel would degrade and my colonies would lift off the plate with the matrix and basically be completely destroyed.

Passaging
There are two main methods for passaging hES and iPS cells: using an enzyme or manually detaching the colonies. Depending on the status of your plate and colonies, one method may be more useful to you than the other. In my experience, when you have fewer than 20 colonies (per well in a six-well plate), it is much better to passage manually. This gives you much more control over what you are detaching from the plate and bringing over to your fresh plate. This should also then be passaged at a 1:1 split unless the colonies you have are pretty large. Even though there are lots of different methods and tools you can use for manual passaging, I’ve found the most effective way to do this is to just use a p200 pipette and tips. This seems to be the perfect size to allow you to score larger colonies into sections while also scraping up the smaller colonies with one scratch. I’ve tried using Pasteur pipettes with the tips curved using a Bunsen burner, but this seems to yield too blunt and irregular tips. I’ve also tried using different-sized needles to break iMEFs off the colonies and score the colonies into smaller pieces, but this often scrapes plastic off the bottom of the plate, getting pieces of plastic mixed into the colony.

If you have over 20 colonies per well, I think it is much easier to go with an enzymatic passage. If you are using a feeder layer, the quality of the colonies may be slightly worse than with manual passaging, because you are picking up the iMEFs in addition to your colonies, which can result in your colonies forming large clumps in the new plate rather than seeding nicely into the new feeder layer. For hES and iPS cell culture, the enzyme used shouldn’t break the cells into a single cell suspension (like Trypsin/EDTA); rather they should be broken into smaller clumps for optimal seeding and growth capabilities. I have used 1mg/ml collagenase type IV (Invitrogen) diluted with DMEM-F12 for passaging with a feeder layer, and Dispase (Stem Cell Technologies) also at 1mg/ml when passaging from Matrigel. Both collagenase and Dispase keep the cells in clumps. Once prepared, collagenase only stores for two weeks, so be sure to not hold on to it for any longer than that; the enzyme becomes weak and ineffective. Even if you are passaging enzymatically, I have found it very helpful to do a little colony cleaning manually beforehand. Getting rid of partially differentiated colonies, breaking up larger colonies into smaller pieces, and teasing away some iMEFS can really make a big difference in the quality of your cells.

When you are removing the cells from the plate after the enzyme treatment, a really effective method for scraping is the “car wash” method. This is done using a 5ml glass serological pipette. While tilting the culture plate slightly forward so that the media forms a pool at the bottom half of the well, you pull up the media, and while releasing the media, scrape in a zigzag pattern from the top of the well towards the bottom. By releasing the media while gently scraping, you help keep the colony-removal process gentle and the cells in bigger clumps. Once you have cleared the top half of the well, flip the plate around so that the other half is on top and repeat the process.

Antibiotic Use
Many people have very different views from mine on the use of antibiotics for hES/iPS culture. I feel very strongly about culturing antibiotic-free, and I will explain why. First of all, it allows you to have more control over the status of your cells. If there is any sort of breach in sterility, without antibiotics, you will immediately know and be able to deal with it by getting rid of the contaminated plates. You never have to live questioning if a plate is infected or not, meanwhile exposing your other plates to the potential infection. Everything is very clear; infections are obvious and therefore can be dealt with swiftly, without jeopardizing the rest of your cells. One of the few times in my iPS culture experience that I was using an antibiotic in my media, after not knowing whether a particular plate was infected, one by one all of my plates became infected and I literally lost every single culture I had. Now, I know that this is probably a pretty extreme case, but in any event, it demonstrated what can happen when antibiotics are battling a bacterial infection. Since the infection was not obvious, I continued to expose my cells to contamination unknowingly and therefore contaminated everything.

Secondly, using an antibiotic can mask mycoplasma infections. Usually, mycoplasma infections are accompanied by other infections—or rather, when the sterility of your cultures is breached, mycoplasma can also be introduced, and they are typically introduced with other infections such as bacteria. If the antibiotic successfully fights off the bacterial infection, your cells will still have the mycoplasma infection, which is typically only detected by using specific mycoplasma detection tests (by taking spent media and testing it). Last year, our iPS facility tested positive for mycoplasma. This was a total disaster. We had to throw away all cell cultures, close down the core for fumigation, and literally throw away all disposable materials in the room including reagents and media. It left us out of commission for a whole month. Not only was this an unbelievably expensive endeavor, it also made us lose valuable time, resources, and in some cases permanently lose cell lines. At the time when this happened, we were all using antibiotics in our media; since then, we have made it a room rule to not use them. Since we have been antibiotic free, we have also been mycoplasma free. Not using antibiotics also helps reinforce good practices in sterile technique, forcing you to be ultra careful with your cells and keep your surroundings very clean. This helps eliminate some variables in culturing, since you have more control over your environment and therefore over culture conditions.

Last notes
I think one of the most important things to remember with iPS cell culture is to be patient. Especially if you are just thawing cells for the first time! Even if it looks like there are no colonies, I would be willing to bet that if you keep feeding and wait, you will see at least one. Sometimes this can be a slow and frustrating process, but just keep at it and you’ll eventually get some great cultures. I was the first person in my lab to do human iPS cells work, so I truly understand how difficult it can be getting things up and running. There are a lot of helpful resources online, and as the stem cell community grows, the resources grow also. The HSCI iPS core has their protocols available online (http://www.hsci.harvard.edu/ipscore/node/8), which I have found to work well. WiCell has many helpful resources and protocols available online as well. I use their protocol for teratoma assays, and it pretty much works without fail (https://www.wicell.org/home/stem-cells/support/stem-cell-protocols/-home-stem-cells-support-stem-cell-protocols-stem-cell-protocols-cmsx-.cmsx).

So, to wrap things up, if you are new to hES/iPS culture, I hope this has lifted the curtain a bit on culture techniques, hopefully helping to eliminate at least a couple variables while you get started. If you have tips of your own now (or later!), please do share! Pooling our secrets, we can help each other out and make some real scientific progress.

Christine Miller is Research Assistant at Harvard University, Joslin Diabetes Center, Amy Wagers Lab.

=================

Standard Operating Procedures (SOP) for the culture of human iPS

In general, caring for hiPS cells is identical to caring for hESCs, which you are assumed to have experience with prior to requesting these cell lines. While there are different ways of culturing these cell lines, the general concepts are the same. Provided are the general instructions we have used to culture hiPS cells (primarily adapted from the protocols from WiCell):

Media

Standard hES Media (500 ml)

  • 400 ml DMEM/F12
  • 100 ml KOSR
  • 5 ml L-Glutamine
  • 5 ml P/S (optional)
  • 5 ml MEM-NEAA
  • 3.5 ul 2-Mercaptoethanol
  • 5 ug bFGF (although WiCell suggests 50 ug, we found that 5 ug is sufficient)

MEF Media (500 ml)

  • 450 ml DMEM
  • 50 ml FBS
  • 5 ml P/S
  • 5 ml L-Glutamine

2X Freezing Media (10 ml)

8 ml defined FBS 2 ml DMSO

Plating MEFs

The iPS cells are typically maintained on 0.1% gelatin coated plates with MEFs. One can alternatively plate these cells on Matrigel and use mTeSR1 media for a feeder-free condition.

Commercial irradiated MEFs may be obtained from Global Stem Cell (CF-1; 6001G) containing about 4-5 million MEFs per vial. It is recommended to plate 1 million MEFs per 10 cm plate (~170,000 per well of a 6-well plate). You should optimize your MEF density as you see appropriate, judged by the level of differentiation of your iPS cells. MEFs should be given 8 hours minimum to settle after plating, although overnight is best (ideally used within 2 days).

Thawing Shipped hiPS Vial

Each vial shipped should be thawed in 1 well of a 6 well plate. The passage number and the name of the cell line can be found on the vial. All other information on the label can be ignored.

These cells should be kept in as large of clumps as possible to increase survival efficiency so one must minimize the amount of pipetting when thawing these vials.

  1. Set up 2x 15 ml conical tubes. In tube 1, add 1 ml of pre-warmed hES media. In tube 2, add 9 ml of pre-warmed hES media.
  2. Partially thaw the frozen vial of iPS cells at 37ºC, until there is a small piece of ice remaining. Spray the vial with 70% ethanol to sterilize.
  3. Taking 1 ml of media at a time from tube 2, slowly add the pre-warmed media dropwise to the vial and transfer the liquid content with cells into tube 1. Repeat until all 9 ml used.
  4. Spin at 1000 RPM for 2 min.
  5. Meanwhile, wash with PBS one well of a 6 well plate that was plated with MEFs atop gelatin one day prior. Add 2 ml hES media. Although not required, it is highly recommended that you add 10 μM ROCK inhibitor Y-27632 (both to 9 mL thawing media in tube 2 and to the final 3 ml of plating media) to improve survival efficiency. Do not add this ROCK inhibitor to any subsequent feeds. (The ROCK Inhibitor Y-27632 Enhances the Survival Rate of Human Embryonic Stem Cells Following Cryopreservation; Li et al.)
  6. Aspirate the media from the spun down tube 1, and gently resuspend the pellet with 1 ml of hES media. Pipet slowly 1 or 2X maximum, trying to avoid disrupting the chunks of cells, and transfer to one well of a 6-well plate.
  7. Change the medium after 36 to 48 hours.
  8. Feed cells daily with 2 ml medium. Colonies should emerge anywhere from 5 to 10 days.
  9. The first split should be mechanical (ratio depending on cell density observed).

NOTE: It is highly recommended that you perform a mycoplasma test upon successful thawing of these cells. It is also recommended that you karyotype the line about every 10 passages.

Passaging hiPS cells

Note: These instructions are for passaging cells grown on MEFs. For cells grown on Matrigel, one should use Dispase in place of Collagenase IV. Trypsinization is not recommended.

1. Before splitting, remove differentiated colonies under a microscope in sterile conditions (i.e. via slow-vacuum aspiration or pipet scraping). Be careful not to leave plate out too long and make sure cells do not dry out if using vacuum method.
2. Wash cells with either warm hES medium or PBS
3. Add 1 ml of Collagenase IV per well of a 6 well plate and incubate at 37ºC for 5-10 minutes (expect to see visible curling or thickening of colonies around the edges).
4. Aspirate off the enzyme and add 1 ml of hES medium. Using a cell lifter (i.e. Corning #3008), scrape the entire well to lift the colonies.
5. Pipet the solution into a conical tube; wash the well with an additional 1 ml hES medium and combine into tube.
6. Centrifuge 1000 RPM (200xg) for 2 min.
7. Aspirate off the media, and resuspend pellet in 1 ml media per well of a 6 well plate that you wish to plate (ratio depends on cell density just prior to splitting). Triturate to get medium-small fragments (~50-200 cells per fragment). Avoid over-triturating since that will lead to cell death, especially when colonies are broken down to single cell suspensions.
8. Plate 1 ml each into a well of a 6 well plate of MEFs that was pre-washed with PBS and containing 1 ml of hES media.
9. We recommend splitting 1:3 if the cells are close to confluency.

Freezing Cells

Note: For cells grown on Matrigel, the cells should be frozen in same manner, except using 500 ul of mFreSR per 6-well.

As with thawing, it is very important to minimize the amount of pipetting to ensure cell survival later on.

  1. Prepare the cells as described in steps 1-6 of “Passaging hiPS cells.”
  2. Aspirate the media and carefully add 250 ul of hES media for every vial you intend to freeze (should freeze either 1 vial per well of a 6 well plate, or 5 vials per 10 cm dish).
  3. Add 250 ul of 2X freezing media for each vial you intend to freeze, and carefully resuspend the pellet in the combined media (keeping cells in as large of chunks as possible; generally pipetting 2x should be enough).
  4. Quickly transfer 500 ul per cryo-vial, and place inside isopropanol-containing freezing container (ie Mr. Frosty; VWR 55710-200). Store 24-48 hrs at -80C and then transfer to liquid nitrogen. (Once DMSO in contact with cells, work quickly and ideally get the cells at -80 within 3 min of contact).

For further information, please consult the following protocols:

  1. WiCell protocol
  2. Lerou et al. Nature Protocols 2008; 3:923-33
  3. Boston Protocols:  http://www.bu.edu/dbin/stemcells/protocols.php
  4. mostoslavskylab: http://www.mostoslavskylab.com/papers/Park_Mostoslavsky_CPSTB_2018.pdf
  5. Doug Melton protocol

Vendor list:

  • DMEM/F12: Invitrogen cat# 11330-057
  • KOSR: Invitrogen cat# 10828-028
  • L-Glutamine: Invitrogen cat# 25030-156
  • Penicillin/streptomycin: Invitrogen cat# 15140-155
  • MEM-NEAA: Invitrogen cat# 11140-050
  • 2-Mercaptoethanol: Sigma cat# M-7522
  • bFGF: Millipore cat# GF-003
  • DMEM: Invitrogen cat# 11965-118
  • FBS: Invitrogen cat# 16000-044
  • Defined FBS: Hyclone cat# SH30070.01
  • DMSO: Sigma cat# D-2650
  • Irradiated CF1 MEFs: GlobalStem cat# 6001G
  • Collagenase IV: Invitrogen cat# 17104-019
  • Dispase: Invitrogen cat# 17105-041
  • Rock inhibitor Y27632: Calbiochem cat# 688000
  • 0.1% gelatin: Millipore cat# ES-006-B

If you have any question, please contact us at: Laurence_Daheron@harvard.edu

siRNA/ASO转染效率低?试试Two-step Trasnfection

Via: https://mbio.asm.org/content/9/3/e00716-18.long#sec-12

Human membrane trafficking gene siRNA screen.The Human siGENOME siRNA Library, which targets 140 membrane trafficking genes (4 siRNAs per gene; Dharmacon, Inc.), and 16 other selected genes were included in the primary screen. In brief, NHDFs were seeded in a 96-well plate a day before siRNA transfection. Next day, cells reached 90 to 95% confluence and were transfected with siRNA twice (4 h apart between first and second transfections) using Lipofectamine RNAiMAX (Invitrogen) according to the manufacturer’s protocol. Transfected NHDFs were incubated for 48 h and then infected with GFP-expressing TB40/E virus at an MOI of 3. GFP intensity was monitored every 24 h with a Synergy HT microplate reader (BioTek). The entire screen was performed in duplicate and repeated twice. At 7 days postinfection, 5 µl supernatant was transferred to fresh untransfected cells and GFP levels were monitored as described above.

Via: https://www.nature.com/articles/s41593-018-0293-z

The neuroblastoma cells (ATCC) were cultured in DMEM/F12 (Gibco) supplemented with 10% fetal-bovine serum (Omega) and 1% penicillin-streptomycin (Gibco) at 37 °C with 5% CO2. For knockdown experiments, cells were transfected with SMARTpool ON-TARGETplus siRNA targeting TDP-43 (L-012394) or control siRNA pool (D001810–10) (GE Dharmacon) at a final concentration of 50 nM, for 96 h in two doses (0, 24 h), after complexing with Lipofectamin RNAiMAX (Invitrogen) in Opti-MEM (Gibco) for 20 min.

细胞裂解中应该注意的问题

You’ve cultured your cells and completed your treatments, now it’s time to harvest them and proceed to the downstream effects. Cell lysis is the crucial stage that determines if your experiment has a chance of producing the data that you have been waiting for. Part of the starting biological material is inevitably lost on each step of your experiment, so it’s critical to extract it all at the beginning. Often, the amount and quality of resulting biological molecules depend on the chosen lysis method (1).

1. Frozen vs. Wet Cells for Lysis
If you work with cytoplasmic enzymes or DNA, it probably doesn’t matter if you are going to do your cell lysis on “just-off-the centrifuge” cells or frozen cells. However, keep in mind that any method that involves wet, non-frozen cells does not completely stop biochemical reactions (2). If you need to get a snapshot of “normal” cellular activity, the sooner you freeze your cells and stop stressing the cells and thereby altering normal transcription and translation, the better.

After you decide on the starting state of your material, there are several things to consider when planning your lysis:

2. Are You Dealing with a Cell Wall?
You are lucky if you work with mammalian or insect cell lines, as they are only surrounded by a thin plasma membrane that doesn’t require mechanical effort to rupture. Gram-negative E.coli is a slightly bigger problem because of multiple rigid peptidoglycan layers . However, if you work with algae, fungi (that include yeast), archaea or plant cells, you need to get rid of at least parts of the cell wall, so cell lysis will require more effort than just adding a detergent and heating cells up.

There’s a difference in cell wall thickness and composition within groups as well. Gram-positive bacteria have many more layers of the main cell wall component peptidoglycan than E.coli and it will require extra effort to lyse them. “Algae” is a diverse group with cell walls of various composition, so it’s worth checking recommended methods, if not for your species than at least for the algal family.

3. Consider Culture Volume
Significantly upscaling you prep without changing the lysis method often creates problems. For example, you were always doing your yeast preps for the western blot on a tabletop bead beater that takes Eppendorf-size screw-top tubes. Now you need to do a large pull down experiment where you need to lyse tens of grams of cells. It would be a mistake to just split your culture into smaller volumes. The smaller the volume, the more material you lose. But even leaving aside the time you will spend aliquoting and pooling you samples, it’s worth exploring lysis options for larger culture volumes: sonicator (suitable for medium-size preps), French press (not the coffee one) or cryogenic tissue grinder.

4. Choosing the Method
You choose your lysis method depending on your downstream application. It can be either mechanical or enzymatic.

  • Mechanical lysis methods include boiling cells with a detergent, vortexing with glass or ceramic beads, grinding cells in liquid nitrogen or sonication. Grinding with beads is suitable for isolation of soluble cytoplasmic proteins or the cell walls but not for preparation of intact mitochondria or plasma membranes. In these cases, enzymatic lysis or protoplast lysis are more appropriate.
  • Enzymatic methods are based on using specific enzymes (no surprise there) to strip off cell wall and osmotic shock to release the cell content. This method is less harsh than the mechanical grinding, so suitable for isolating intact cell structures such as mitochondria.
  • Detergent methods are quick but you need to make sure that you know how to get rid of the detergent afterwards. The leftover detergent can interfere with your downstream biochemical assays.

Considering your lysis options before starting the experiment will save you time and reagents, and help you get the answers you were looking for the first time around!

Literature:
Sohrabi M. et al. (2016) The yield and quality of cellular and bacterial DNA extracts from human oral rinse samples are variably affected by the cell lysis methodology. J Microbiol Methods. 122:64-72. doi: 1016/j.mimet.2016.01.013.

Lee S. J. et al. (2017) Cost-effective and rapid lysis of Saccharomyces cerevisiae cells for quantitative western blot analysis of proteins, including phosphorylated eIF2?. Yeast. 34(9):371-382. doi: 1002/yea.3239.

Tetbow:一种神经元多色标记的方法

Stochastic multicolor labeling is a powerful solution for discriminating between neurons for light microscopy-based neuronal reconstruction. To achieve stochastic multicolor labeling, Brainbow used the Cre-loxP system to express one of the three fluorescent protein (XFP) genes in a transgene. When multiple copies of the transgene cassette are introduced, stochasticity will result in a combinatorial expression of these three genes with different copy numbers, producing dozens of color hues (Livet et al., 2007; Cai et al., 2013). However, the brightness of Brainbow was inherently low. This is because the stochastic and combinatorial expression of fluorescent proteins is only possible at low copy number ranges, resulting in low fluorescent protein level.

The principle of Tetbow

In modern neuroscience, plasmid or viral vector-mediated gene delivery is more common than conventional transgenic strategies. In such vector-based gene delivery systems, the stochastic expression of XFPs is possible by simply introducing a mixture of XFP genes. Stochastic multicolor labeling is possible when each of the XFP genes is introduced at ~2 copies per cell per color, following a Poisson distribution. To overcome the limited expression levels of XFPs in the original method, we used the Tetracycline trans-activator system to boost the expression levels, and we named the system Tetbow (Tetracycline trans-activator Brainbow) (Sakaguchi et al., 2018) (Figure 1). Once introduced, fluorescent proteins were best imaged after tissue clearing with SeeDB2 (Ke et al., 2016, 2018).

multicolor labeling tetbow

How to use Tetbow for neuronal labeling

To use Tetbow, you can introduce the four Tetbow plasmids (Addgene #104102 – #104105) using in utero electroporation or with AAVs (prepared with Addgene #104110 – #104112) (Figure 2). We’ve also created constructs with containing chemical tags such as the SNAP-tag, Halo-tag, and CLIP-tag (Kohl et al., 2014) (Addgene #104106 – #104108) (Figure 3) that can be introduced using in utero electroporation. Then at your preferred time points, sacrifice the animals and fix the samples. When you use AAVs, it typically takes a few weeks to achieve optimal expression of XFPs. Any longer and the cells may start to show morphological abnormalities due to the excessive amount of XFPs expressed. Then, clear the samples and visualize.

For more details on this procedure, find the protocol here.

multicoloring labeling using tetbow

chemical tagging tetbow

Tips and troubleshooting

  1. Plasmid concentrations and AAV titer – The XFP genes have to be introduced at ~2 copies per cell per color to achieve the highest color variations. Adjust the plasmid concentrations or AAV titer for the best results.
  2. The timing of sacrifice when using Tetbow AAVs – You will have to wait a few weeks to achieve an adequate expression level of the Tetbow AAVs. However, you should not wait too long, as too much XFP is toxic to the cells.
  3. Inadequate expression levels of XFPs – Reduce the amount of tTA. Paradoxically, too much tTA leads to a reduced expression level of XFPs, most likely by suppressing transcription. It is critical to express a minimal amount of tTA to achieve highest expression levels.
  4. Clearing large tissues – Fluorescent proteins are very stable in SeeDB2. However, SeeDB2 is not powerful enough for large brain samples. For large brain samples, we recommend pretreatment with ScaleCUBIC1 (Susaki et al., 2014), before clearing with SeeDB2.

To see Tetbow in action, watch the video below depicting dendrite wiring of mitral cells.


via addgene: https://blog.addgene.org/tetbow-bright-multicolor-labeling-for-neuronal-tracing


RNA-Seq的序列比对:哪种算法最合适?

RNA-Seq has replaced microarrays for many applications in the area of biomarker discovery. The prices have been fallen substantially in recent years. The sequence data allows to extract more information than gene expression only. And there is no requirement that a reference genome must exist. However, the analysis of the resulting data is much more challenging and requires more ressources than other approaches.

RNA-Seq read alignment

One of the most ressource-intensitve steps during a NGS data analysis is the alignment of the sequence reads to the reference genome. Therefore, a common question is about choosing the best NGS alignment tool. As we show in the referenced article, finding the best tool is not possible without in-depth examination of your use case.

Finding an optimal alignment of NGS sequence reads is already a challenging task, and for RNA sequencing data is has to be carried out millions of times. Compared to the alignment of DNA sequences, tools aligning sequences from RNA transcripts have to cope with intronic sequences that lead to large gaps in the alignment.

Our method of comparing RNA-Seq mappers

In order to compare different short read aligners, we use a published, real-life RNA-Seq dataset. All optimal alignments (also multiple mapping loci) of 100,000 read pairs of each sample were calculated with the full sensitivity mapping tool RazerS 3. In the benchmark shown below, we measured the performance in finding all optimal hits of different NGS mappers with default parameters. True positives are reads with up to 10 multiple mapping loci, allowing up to 10 errors (mismatches and indels). Note that we explicitely want to find all multiple mapping loci in this benchmark and not only unique mapping loci or just one random hit of several. We have used the publicly available SRR534289 dataset. Please find more information in the benchmark details here.

Sensitivity and accuracy

The following comparison addresses the question: how accurate do the tools report alignments when compared to the known truth. On-target hits means how many of the reported alignments do actually map to one of the true locations for this sequence. False positives counts the number of reported alignments that do not map to any of the true positions.

sensitivityOn-target hitsmRNA-Seq99.1%100.0%99.1%97.8%100.0%99.7%98.8%Bowtie2(v.2.1.0)segemehl(v0.1.7)BWA(v.0.7.4)BWA-MEM(v.0.7.4)STAR(v.2.3.0e)GEM(v.1.376)BBMap(v.34.41)979899100

sensitivity: 99.95%

false positives

False positive hitsmRNA-Seq3261461212021580333Bowtie2(v.2.1.0)segemehl(v0.1.7)BWA(v.0.7.4)BWA-MEM(v.0.7.4)STAR(v.2.3.0e)GEM(v.1.376)BBMap(v.34.41)05001000150020002500

Runtime and memory requirements

Next, we tracked the computational ressources that are beeing used by running the different tools. Note that several tools need significant more memory than a typical desktop computer has.

timeUser time [s] *mRNA-Seq97.45175.163.2430.087.0315.6458.01Bowtie2segemehlBWABWA-MESTARGEMBBMap050100150200250300350400450500

BBMap● user time: 458.01 s

GBMemory consumption [GB]mRNA-Seq3.7670.053.855.7528.124.7389.24Bowtie2segemehlBWABWA-MESTARGEMBBMap **0102030405060708090100

segemehl● memory consumption: 70.05 GB

* The time shown includes the (for some tools dominating) index loading step, which will be less influential (or even negligible) when mapping real-life datasets (>10 Mio reads).
** By default BBMap takes as much memory as the system provides. The minimum requirement for the used genome is 24GB.

Other common decision factors for choosing an RNA-Seq aligner

Further criteria that people commonly use for selecting an aligner are

  • Additional information provided, for example on splicing
  • Addtional functionality, e.g. soft clipping
  • Interplay with other upstream or downstream tools
  • Maturity level and development activity
  • Number of citations of the respective publication

一抗标记的5种方法

1. NHS (Succinimidyl) Ester Method

This method is useful for the conjugation of antibodies with widely available fluorescent dyes such as rhodamine derivatives. It is typically performed in a phosphate buffer with subsequent on-column separation from the unlabeled dye. The main disadvantage is that the esters are unstable because they are moisture-sensitive. The labeled antibody should be used immediately after the end of the reaction.

2. Isothiocyanate Method

You may used this method to make fluorescein isothiocyanate (FITC), which is very popular in the preparation of fluorescent proteins and antibodies. If you’ve worked with fluorescent microscopy, you’ve dealt with FITC. Isothiocyanate analogues of different standard dyes are also available.

Isothiocyanate is more stable than NHS but it is harder to make and your labeling reaction will likely be less efficient with this method. As with NHS, the excess dye should be removed after the reaction by chromatography.

3. Carbodiimide Method

Carbodiimide-derived compounds convert carboxyl groups on proteins into reactive intermediates that can react with lysines. The high reactivity of carbodiimides means that they can be used to label antibodies with relatively inert materials such as magnetic or gold particles. The most commonly used carbodiimide is EDC. NHS is sometimes added to the reaction to aid the formation of relatively stable intermediates.

The method is simple, but similarly to NHS, EDS is hygroscopic, so you will need to use your antibody immediately after labeling.

4. Two-Tag Method

Here, you label your antibody with another protein that serves as a catalyst, for example HRP or alkaline phosphatase. As both of the molecules contain numerous amino-groups, direct cross-linking (as with the NHS method) would lead to polymers of the same molecule. Therefore, you would perform the linking in two separate steps. You cross-link the antibody to molecule X and the catalyst to molecule Y. You need to choose X and Y carefully because they should interact to form the conjugate. For example, you could choose maleimide as X and a thiol as Y.

While the resulting conjugate will more stable that what you obtain with the NHS method, this method will require three times as much work; separate labeling and purification steps for the antibody, catalyst, and the conjugating reaction. The good news is that you can buy pre-labeled catalytic molecule and then label your antibody accordingly.

5. Periodate Method

This method is useful for generation specific HRP-antibody conjugates. Periodate activates HRP by creating aldehyde molecules that interact with lysine residues. The HRP itself has only a few lysine residues, so enzyme polymerization is not a significant concern. The bonds between HRP and the antibody are reversible unless stabilized by adding sodium cyanohydride.

That was my run down of the top home-made antibody labeling methods. There are a lot of commercial kits on the market with similar underlying chemistry that may make your life much easier. If your lab has the money.

Do you have another antibody labeling method that you’d like to share with us? Get in touch by writing in the comments section.

Literature:

Meyer JP, Adumeau P, Lewis JS, Zeglis BM. Click Chemistry and Radiochemistry: The First 10 Years. Bioconjug Chem. (2016) 27(12):2791-2807. doi: 10.1021/acs.bioconjchem.6b00561. Epub 2016 Nov 22.

RNA-Seq的序列分析及质控

Branded-Copy-of-Thermo-RNA-seq-data-analysis.png
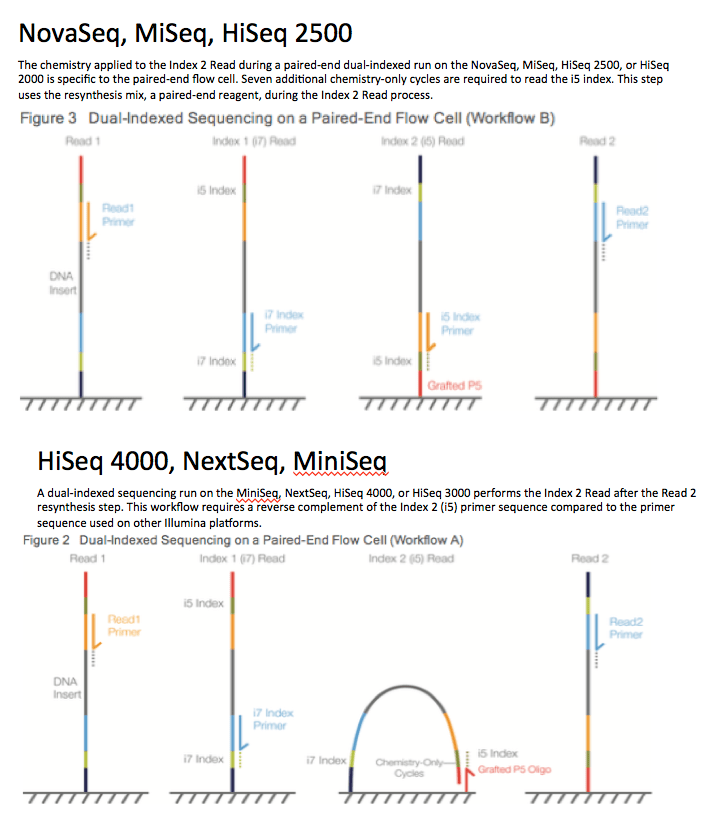
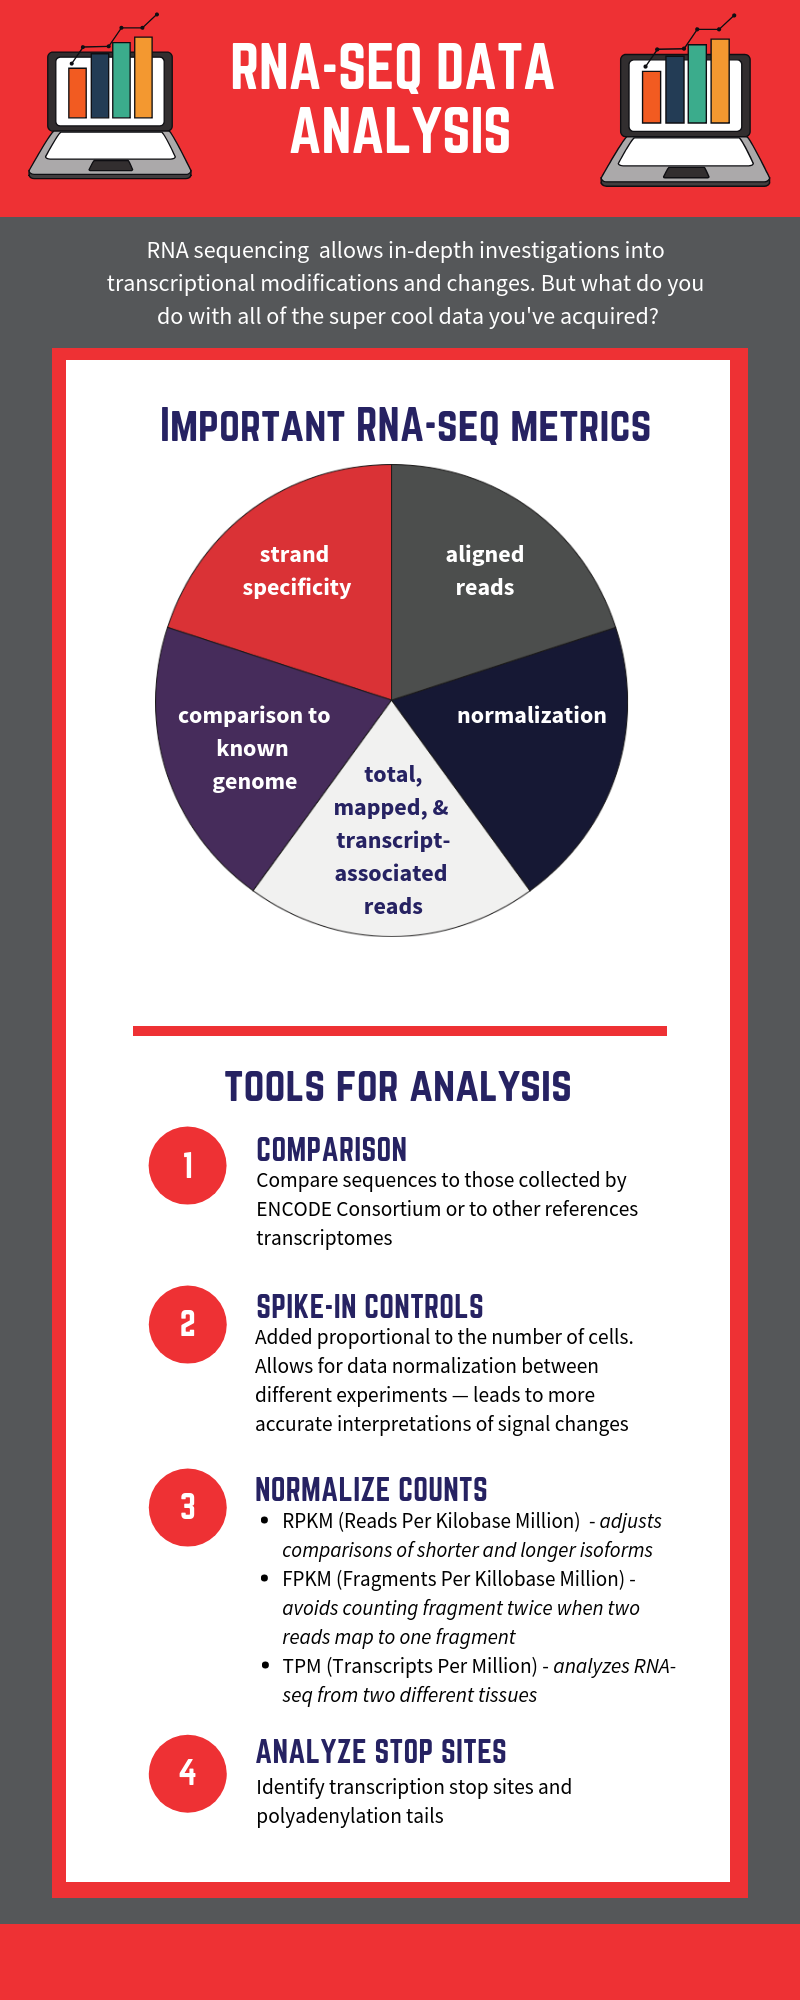
RNA-seq is based on next-generation sequencing (NGS) and allows for discovery, quantitation and profiling of RNA. The technique is quickly taking over a slightly older method of RNA microarrays to get a more complete picture of gene expression in a cell.

Data generated by RNA-seq can illustrate variations in gene expression, identify single nucleotide polymorphisms (SNPs), profile transcription and identify new genes. RNA-seq is better suited for following rapid changes in cellular transcriptomes, finding post-transcriptional modifications, gene fusion, and other changes in transcripts. Modern NGS methods have made these discoveries faster to come across.

Key Metrics in RNA-Seq

A number of key data points have been found to be valuable for interpreting RNA-seq results. These include:

  • Total, mapped and transcript-associated reads: Reads (cDNA fragments, often produced in tens of millions) are mapped to the genome or transcriptome. More reads will indicate a deeper analysis and discovery of lower-expression genes. Percentage of mapped reads will indicate the accuracy of sequencing and rule out contaminating DNA. And transcript-associated reads will reveal the existence of regulatory and expression regions.
  • Aligned reads: Matching the reads to a reference sequence, or known genome, will show similarities and differences.
  • Strand specificity: Some library preparation approaches allow for the retention of strand-specific information so that aligned cDNA-derived reads correspond to the original mRNA.
  • Normalization: Methods used to remove technical biases from sequencing and improve comparability of test sequences to references. These include spike-in controls such as the Invitrogen ERCC controls, and a number of mathematical adjustments described below.

Tools for RNA-Seq Data Analysis

Methods for evaluating how RNA-based mechanisms impact gene regulation and disease and phenotypic variation include comparisons to sequences collected by the ENCODE Consortium, an international collaboration of genetic scientists funded by the US Human Genome Research Institute, and/or comparisons to reference transcriptomes, the number and variety of which are growing rapidly and largely available online. Other analysis software, such as the Partek Genomics Suite, analyzes microarray, qPCR, and pre-processed NGS data from a desktop computer. The Galaxy Project community hub posts a course adapted from Weill Cornell Medical Center on how to use these analytical tools.

Spike-In Controls

A mistaken assumption in sequencing is that all RNA yields are equal. Cells from different experimental conditions, however, do not yield identical amounts of DNA and RNA, reducing comparability of sequences.

Spike-in controls must be added proportional to the number of cells for data normalization, allowing accurate interpretations of true increases (or decreases) in signals. The Invitrogen external RNA control consortium (ERCC) spike-in control mix provides a blend of synthetic transcripts that mimic the lengths of natural eukaryotic mRNAs.

The more abundant a unique read is, the more likely fragments from it are going to be sequenced. But counts need to be normalized, so they can compare with other reads, samples and experiments. A number of mathematical adjustments make this possible:

  • RPKM: Reads Per Kilobase Million, this adjusts comparisons of shorter and longer isoforms (since longer isoforms will have more reads). In this case, this is done by dividing the number of reads by the kilobase number, and then compared to the total number of fragments (usually in the millions).
  • FPKM: Fragments Per Kilobase Million, this is similar to RPKM, but accounts for the fact that two reads can map to one fragment and avoids counting that fragment twice.
  • TPM: Transcripts Per Million, this helps analyze RNA-seq data from two different tissues. RPKs will be the identical in each sample for the same isoform, TPM will compare to total number of transcripts to identify differences between tissues.

Analyzing Stop Sites

Identifying transcription stop sites and polyadenylation poly(A) can often require a special type of sequencing. PolyA tails are important because they are part of the process leading to transcription stops and the creation of mature mRNA. They are often added to the 3’ terminal of RNA to stabilize the RNA in eukaryotic cells, making translation more efficient. The InvitrogenTM CollibriTM Stranded RNA Library Preparation kit for IlluminaTM systems can help to sequence the poly(A) tail and identify these sites and alternative adenylation more easily without additional sequencing steps.

RNA-Seq Provides New Avenues for Research

RNA-seq is quickly helping gain understanding of the complexities of gene expression —complexities that may help develop new ways to diagnose and treat cancer and a host of other diseases and determine genetic solutions in applications ranging from agriculture to health to industry. But much of this complexity invites the risk of observational bias, including assumptions of rates of RNA expression yields, and comparisons of reads. Fortunately, many tools are available that can help normalize RNA-seq data and help make meaningful conclusions from different experimental conditions.


RNA-Protein互作的一些基本概念和技术

Techniques for Analysing RNA–Protein Binding

Capture Hybridization Analysis of RNA Targets (CHART)
CHART has been used to identify RNA-bound DNA or protein partners in Drosophila cells. This technique is a hybridization-based strategy that specifically enriches endogenous RNAs along with their targets with complementary oligonucleotides from reversibly crosslinked chromatin extracts.

Chromatin Isolation by RNA Purification (ChIRP)
Similar to the CHART assay, the ChIRP method is based on affinity capture of target lncRNA-associated DNA or proteins by biotinylated and tiling antisense oligos . The probe design requires prescreening and validation for maximum hybridization efficiency.

RNA Antisense Purification (RAP)
Similar to the CHART and ChIRP methods, RAP uses biotinylated antisense oligos and was first used to determine the localization of Xist . RAP uses 120-nucleotide antisense RNA probes to form extremely strong hybrids with the target RNA.

Crosslinking Immune Precipitation (CLIP) and Its Derivatives (HTS-CLIP, PAR-CLIP, iCLIP, etc.)
CLIP and its derivatives have been used to map the RNA sequences bound to an RNA-binding protein in vivo with high resolution and specificity. Essentially, after UV crosslinking between RNA and its binding protein, the RNA–protein complex is immunoprecipitated using an antibody. The bound RNAs are ligated to an RNA linker, purified, and analysed by sequencing.

Techniques for Mapping RNA Bound to Chromatin

Mapping RNA–Genome Interactions (MARGI)
This technique has been used for mapping global RNA–chromatin interactions in human embryonic stem cells and human embryonic kidney cells. After extraction of formaldehyde/DSG crosslinked chromatin, RNA–DNA is bridged with a biotinylated double-strand oligo by proximity ligation and is purified and converted to a sequencing library for paired-end sequencing.

Global RNA Interactions with DNA by Deep Sequencing (GRID-seq)
Similar to the MARGI method, the GRID-seq method applies proximity ligation RNA to DNA with a biotinylated linker in situ on fixed chromatin, which reduces nonspecific interactions, in human, mouse, and Drosophila cells. Biotin-purified products are cleaned with native polyacrylamide gel electrophoresis and are analysed using single-end 100-bp sequencing.

ChAR-seq
Similar to the MARGI and GRID-seq methods, ChAR-seq uses proximity ligation with a biotinylated oligo in situ on fixed chromatin in Drosophila cells. ChAR-seq prepares relatively longer RNA and DNA fragments (20–100 bp) than the methods above and uses 152-bp single-end reads to sequence across the entire junction of the bridge.

Chromatin-Enriched RNAs (cheRNAs)
Stringent nuclear fractionation coupled to RNA sequencing. Purified nuclei from HEK293 cells are extracted with a 0.5-M urea/0.5%-NP-40 buffer to yield a soluble nuclear extract and insoluble chromatin pellet, and both pools are sequenced. Tightly chromatin-associated lncRNAs identified from insoluble fraction are termed cheRNA.

DNA:RNA Immunoprecipitation (DRIP-seq)
DRIP-seq has been used for mapping DNA:RNA hybrid across the genome in human pluripotent Ntera2 cells using the monoclonal S9.6 antibody recognising DNA:RNA hybrids in a sequence-independent manner.

Polymerase II-Transcribed RNAs in Mammalian Cells.png In Vivo and In Vitro RNA-Labelling Methods.png

via: https://www.sciencedirect.com/science/article/pii/S0962892418302174

利用Image J分析条带浓度

其实这类资源,网络上遍拾即是。但是很多有一定的误导性。跟几个labmate探讨了一下这个过程中可能碰到的问题,在此总结一下总体流程。

工具:
Photoshop CC 20.0
Fiji (Fiji is a distribution of ImageJ which includes many useful plugins contributed by the community.)

参考网页:https://di.uq.edu.au/community-and-alumni/sparq-ed/sparq-ed-services/using-imagej-quantify-blots

点击以访问 ImageJ.pdf

https://alfresco.uclouvain.be/alfresco/service/guest/streamDownload/workspace/SpacesStore/62eef827-f095-4bfd-b607-e0688df2317c/ImageJ%20-%20western%20blot%20quantification.pdf?a=true&guest=true

步骤:

1. 用PS打开图片,点击View-Show-Grid
2. Edit-Free Transform, 这个操作可以任意角度旋转图片,根据第一步的方格,调整所有带处于水平位置,方便定量。
3. 保存调整好的图片为jpg格式。

4. 打开image j,导入保存好的jpg图片。
5. 点击软件第二栏中的第一个方框,然后在图中选择第一条泳道。技巧:把框选长一点,这样拖动时比较容易操作。因为如果拖动方框过程中如果改变了方框形状,只能从头开始。

ImageJ
6. Analyze-Gel-Select First Lane

Using ImageJ Figure 2
7. 拖动方框到第二泳道,在键盘上敲击“2”。重复此操作,每次操作都输入“2”。这样软件会自动按序对每个泳道进行标记。

Using ImageJ Figure 4
8. Analyze-Gel-Plot Lanes
9. 这时每个泳道都会出现一个对应的峰形。按住shift,截取single peak。技巧:线条必须跨越峰的两侧,否则后面定量时,会高亮方框内所有面积。

Using ImageJ Figure 6
10. 点击Analyze-Measure,再点击软件第二栏中的”A” 左边的小棒,然后回到刚才截取的single peak里点击一下,就会在右侧出现对应的浓度。

Using ImageJ Figure 7
11. 导出到excel表格,计算。计算方法: http://lukemiller.org/index.php/2010/11/analyzing-gels-and-western-blots-with-image-j/